Fig. 2
Download original image
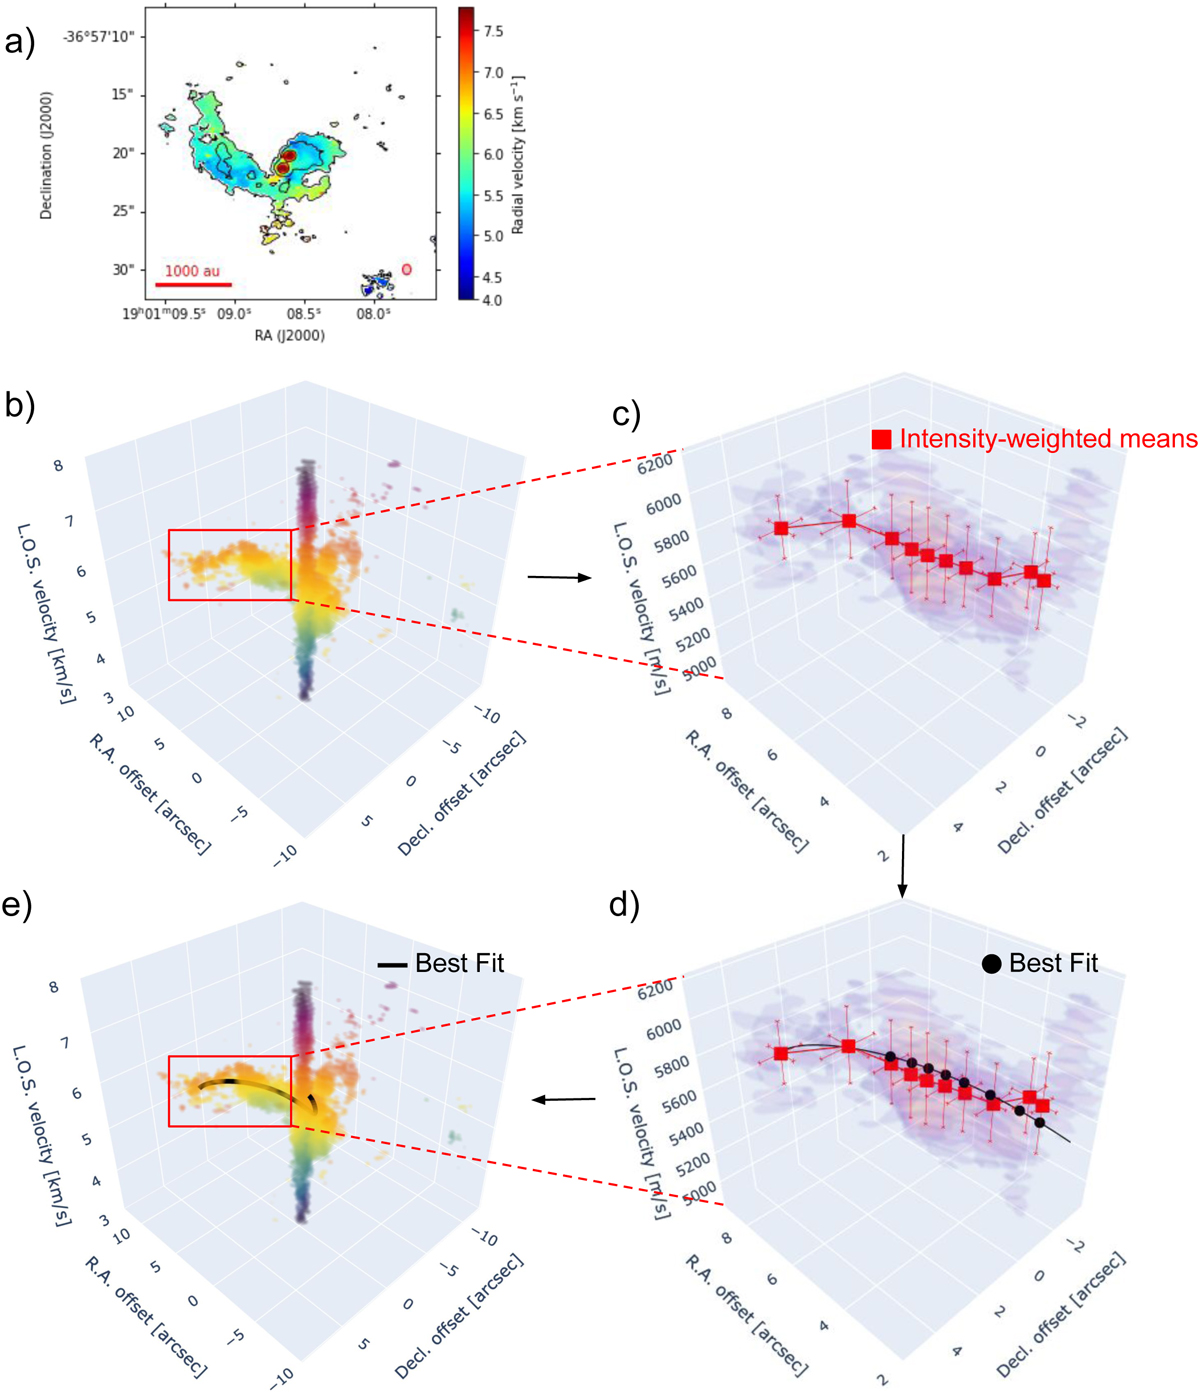
Flow of S CrA 13CO (2–1) data in the TIPSY pipeline. Panel a: intensity-weighted velocity (moment 1) map in colors, overlaid with contours representing the integrated intensity (moment 0; see Fig. E.1). The red segments in the bottom-left corners depict a length scale of 1000 au. The pink ellipses in the bottom-right corners depicts the beam size of the data. Panel b: isometric projection of the 3D PPV diagram of pixels with intensity >5σ in the whole field of view. Panel c: isometric projection of the PPV diagram of an isolated and cleaned streamer. The red square and its error bars represent intensity-weighted means and standard deviations, respectively. Panel d: same as panel c, but with the best-fit trajectory, as represented by the black line. Black circles denote the interpolated values of the theoretical trajectory, which are directly compared to the intensity-weighted means. Panel e: same as panel b, but with the best-fit trajectory, as represented by the black line. 3D interactive versions of panels d and e are available online.
Current usage metrics show cumulative count of Article Views (full-text article views including HTML views, PDF and ePub downloads, according to the available data) and Abstracts Views on Vision4Press platform.
Data correspond to usage on the plateform after 2015. The current usage metrics is available 48-96 hours after online publication and is updated daily on week days.
Initial download of the metrics may take a while.