Fig. 1
Download original image
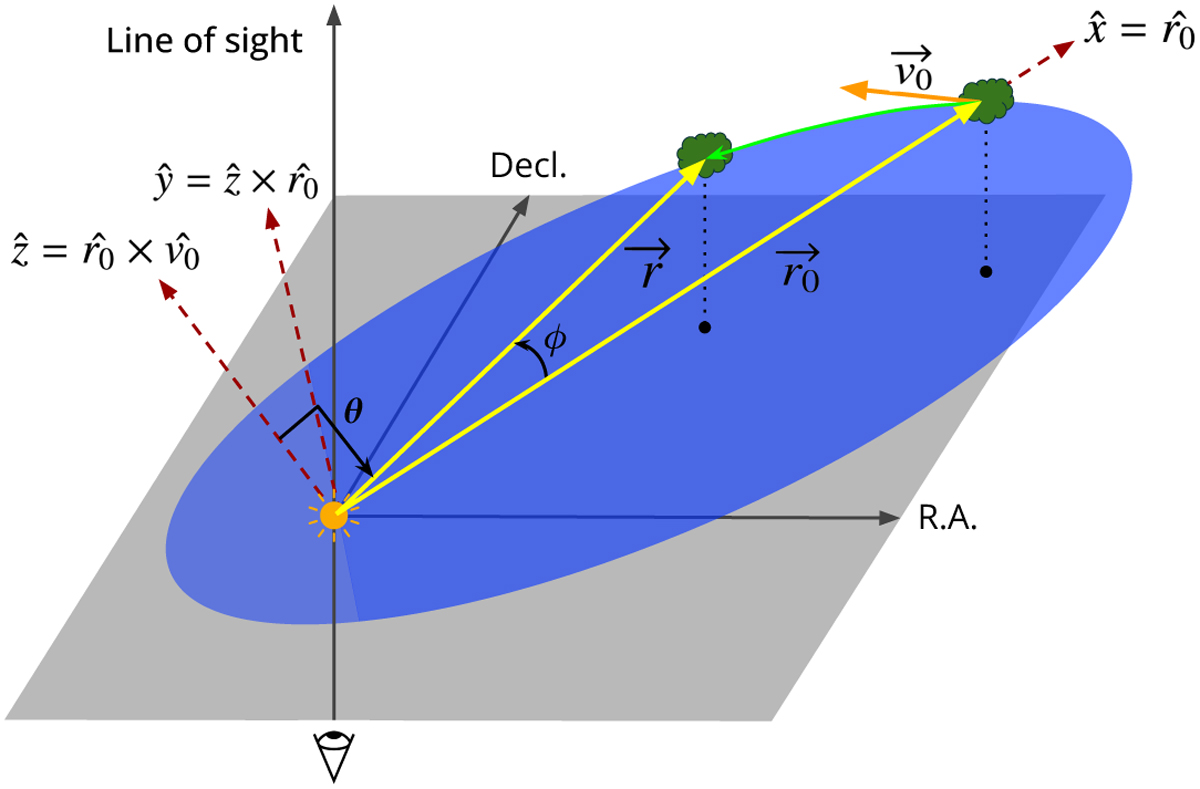
Schematic diagram of coordinate axes used to compute the theoretical trajectories of infalling gas (green cloud) around a protostellar system (orange star), as discussed in Sect. 2.1. ![]() denote the initial position and velocity vector of infalling gas, respectively.
denote the initial position and velocity vector of infalling gas, respectively. ![]() represents the position vector of gas at a future point in its trajectory (circumference of blue ellipse), with θ and ϕ denoting the polar and azimuthal angles, respectively. The dashed red arrows show the unit vectors
represents the position vector of gas at a future point in its trajectory (circumference of blue ellipse), with θ and ϕ denoting the polar and azimuthal angles, respectively. The dashed red arrows show the unit vectors ![]() , and
, and ![]() , defined using the directions of
, defined using the directions of ![]() . Together they set the coordinate frame in which TIPSY solves the Mendoza et al. (2009) equations. The gray plane represents the POS, with the overlaid dark gray arrows denoting the coordinate frame of our observations.
. Together they set the coordinate frame in which TIPSY solves the Mendoza et al. (2009) equations. The gray plane represents the POS, with the overlaid dark gray arrows denoting the coordinate frame of our observations.
Current usage metrics show cumulative count of Article Views (full-text article views including HTML views, PDF and ePub downloads, according to the available data) and Abstracts Views on Vision4Press platform.
Data correspond to usage on the plateform after 2015. The current usage metrics is available 48-96 hours after online publication and is updated daily on week days.
Initial download of the metrics may take a while.