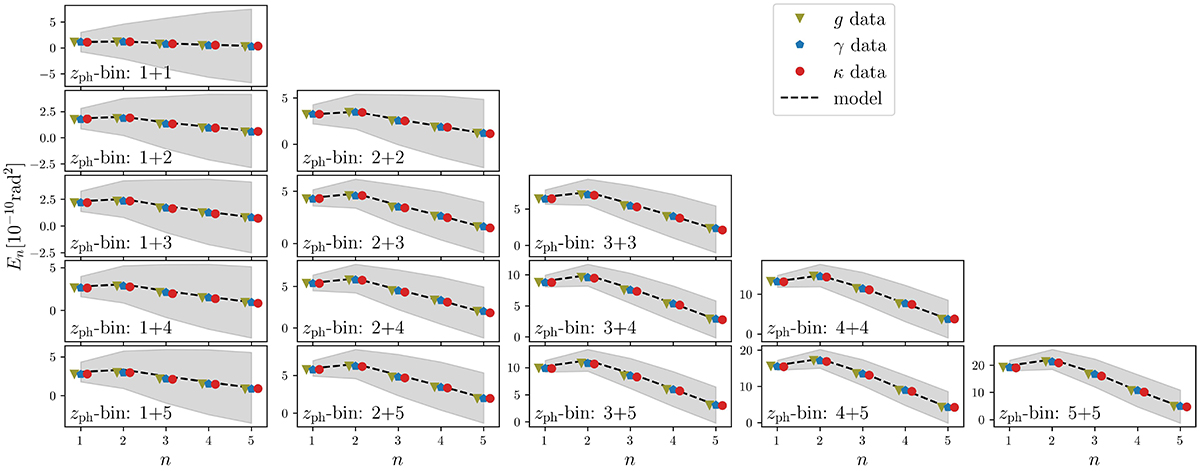
Fig. 2.
Download original image
Measured and modelled En vector for the first five moments in the T17 mock data. The green and blue dots are the mean of all 1944 KiDS-1000 mock data that are also used to compute the covariance matrix with a resolution Apix = 0.18 arcmin2 and shape noise. The red dots represent the data vector measured from one full-sky T17 realisation with a resolution Apix = 0.18 arcmin2 and no shape noise. The grey band indicates the expected uncertainty from the KiDS-1000 survey.
Current usage metrics show cumulative count of Article Views (full-text article views including HTML views, PDF and ePub downloads, according to the available data) and Abstracts Views on Vision4Press platform.
Data correspond to usage on the plateform after 2015. The current usage metrics is available 48-96 hours after online publication and is updated daily on week days.
Initial download of the metrics may take a while.