Fig. A.1.

Download original image
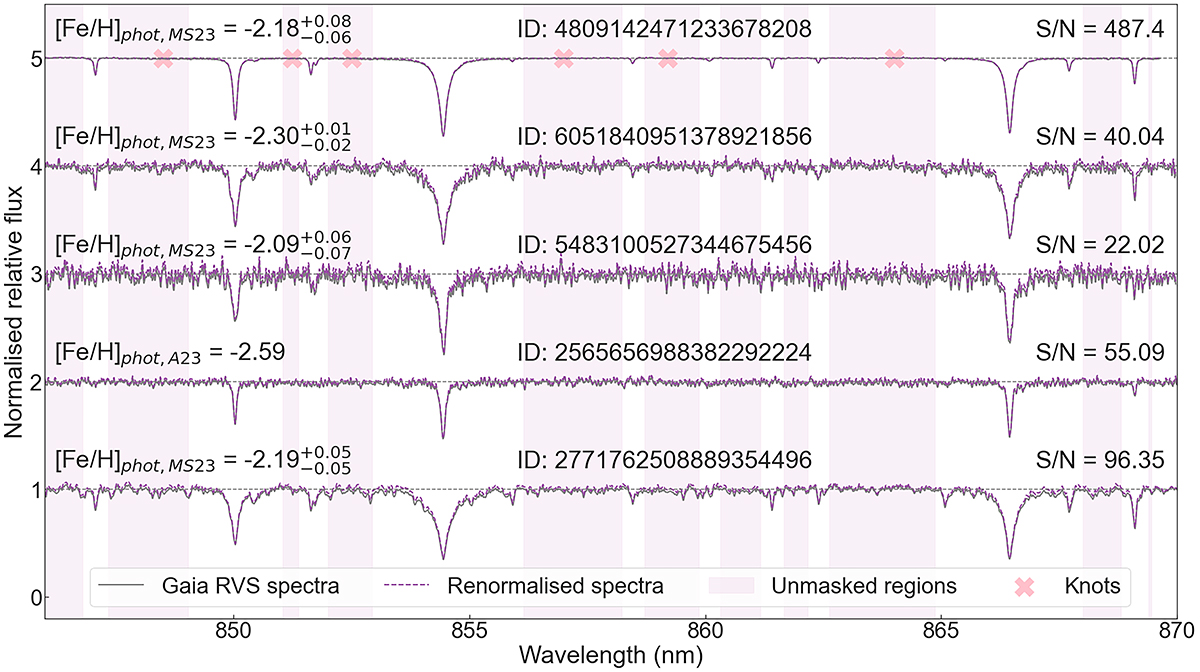
Gaia RVS spectra in gray of a selected subset of five stars chosen with varying signal-to-noise and metallicities. Renormalised Gaia spectra in purple. The topmost spectra is the highest signal-to-noise spectra used to choose knots and masks to perform spline interpolation to infer the continuum. Gray lines represent the released Gaia RVS spectra and purple lines represent the renormalised RVS spectra using spline representation. Purple bands show the unmasked region to define the continuum and red cross symbols show the chosen knots.
Current usage metrics show cumulative count of Article Views (full-text article views including HTML views, PDF and ePub downloads, according to the available data) and Abstracts Views on Vision4Press platform.
Data correspond to usage on the plateform after 2015. The current usage metrics is available 48-96 hours after online publication and is updated daily on week days.
Initial download of the metrics may take a while.


