Open Access
Fig. B.1.
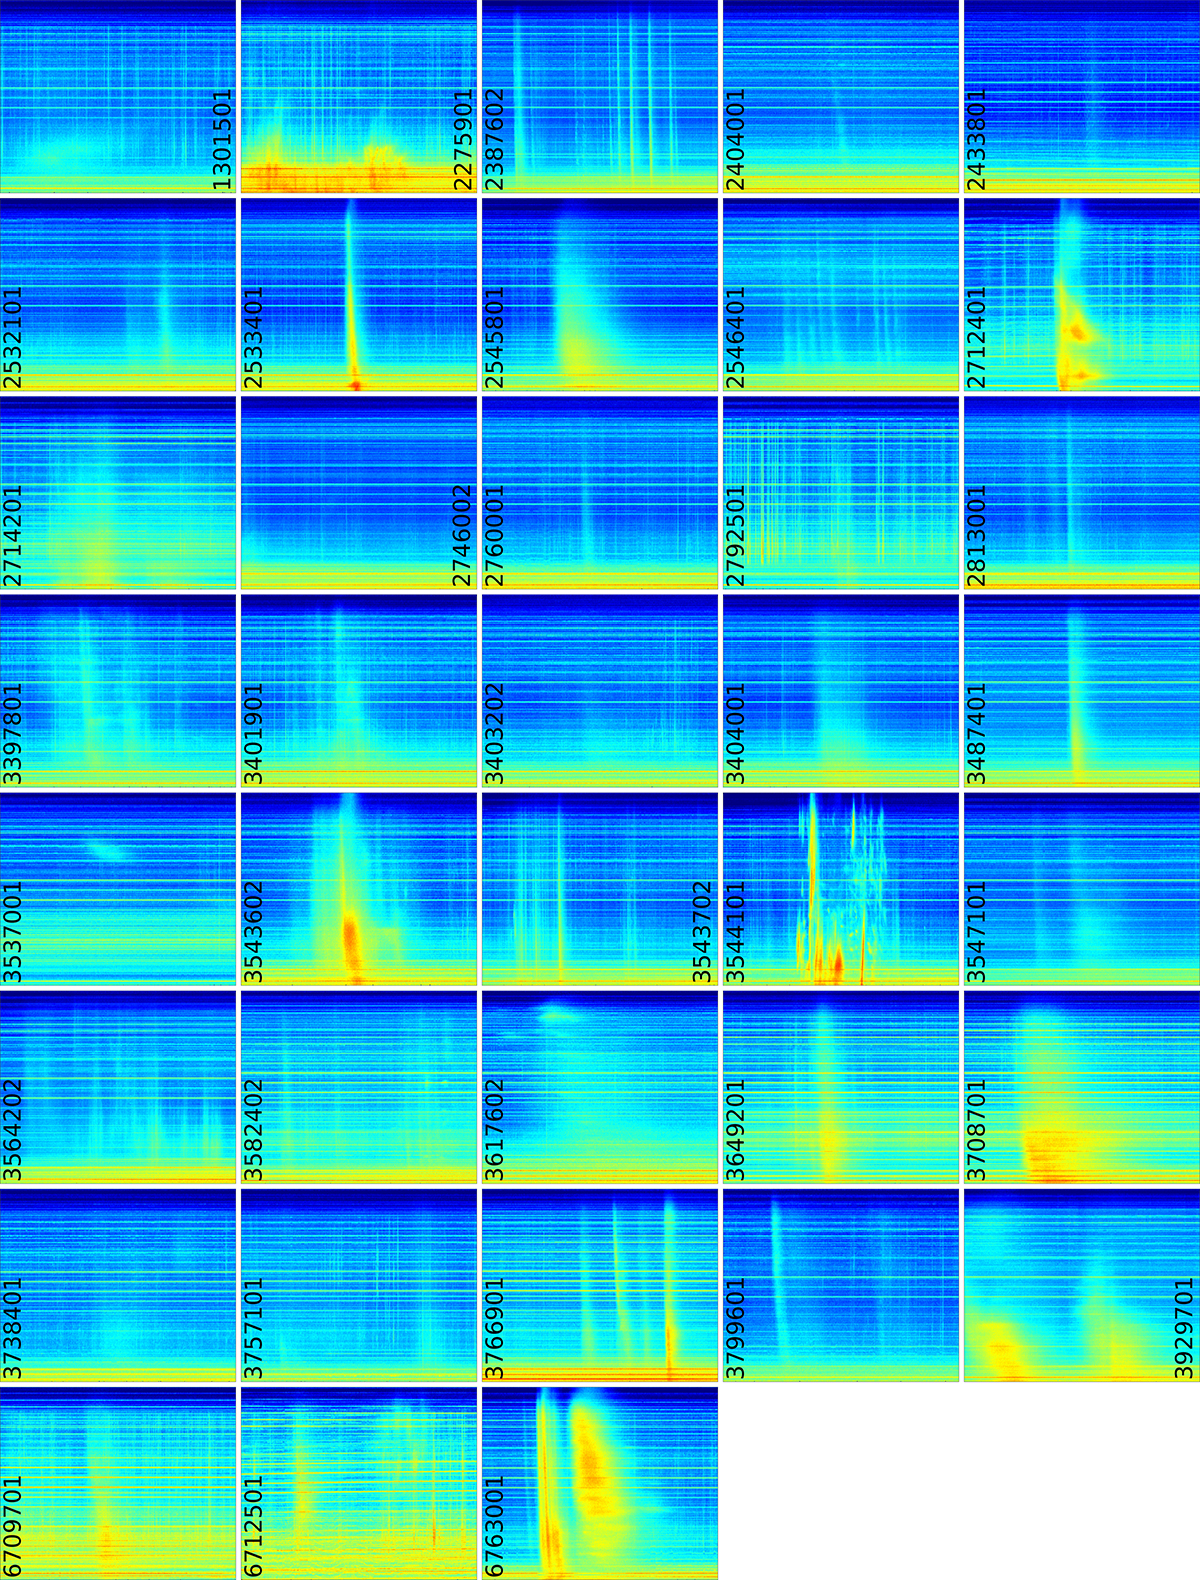
Download original image
Dynamic spectra of all SHARAD-detected solar radio burst products. The y-axis goes from 13.3 to 26.7 MHz for all images. The x-axis bounds are specified in Table 1. The dynamic range of the image can vary from acquisition to acquisition.
Current usage metrics show cumulative count of Article Views (full-text article views including HTML views, PDF and ePub downloads, according to the available data) and Abstracts Views on Vision4Press platform.
Data correspond to usage on the plateform after 2015. The current usage metrics is available 48-96 hours after online publication and is updated daily on week days.
Initial download of the metrics may take a while.