Open Access
Fig. 7
Download original image
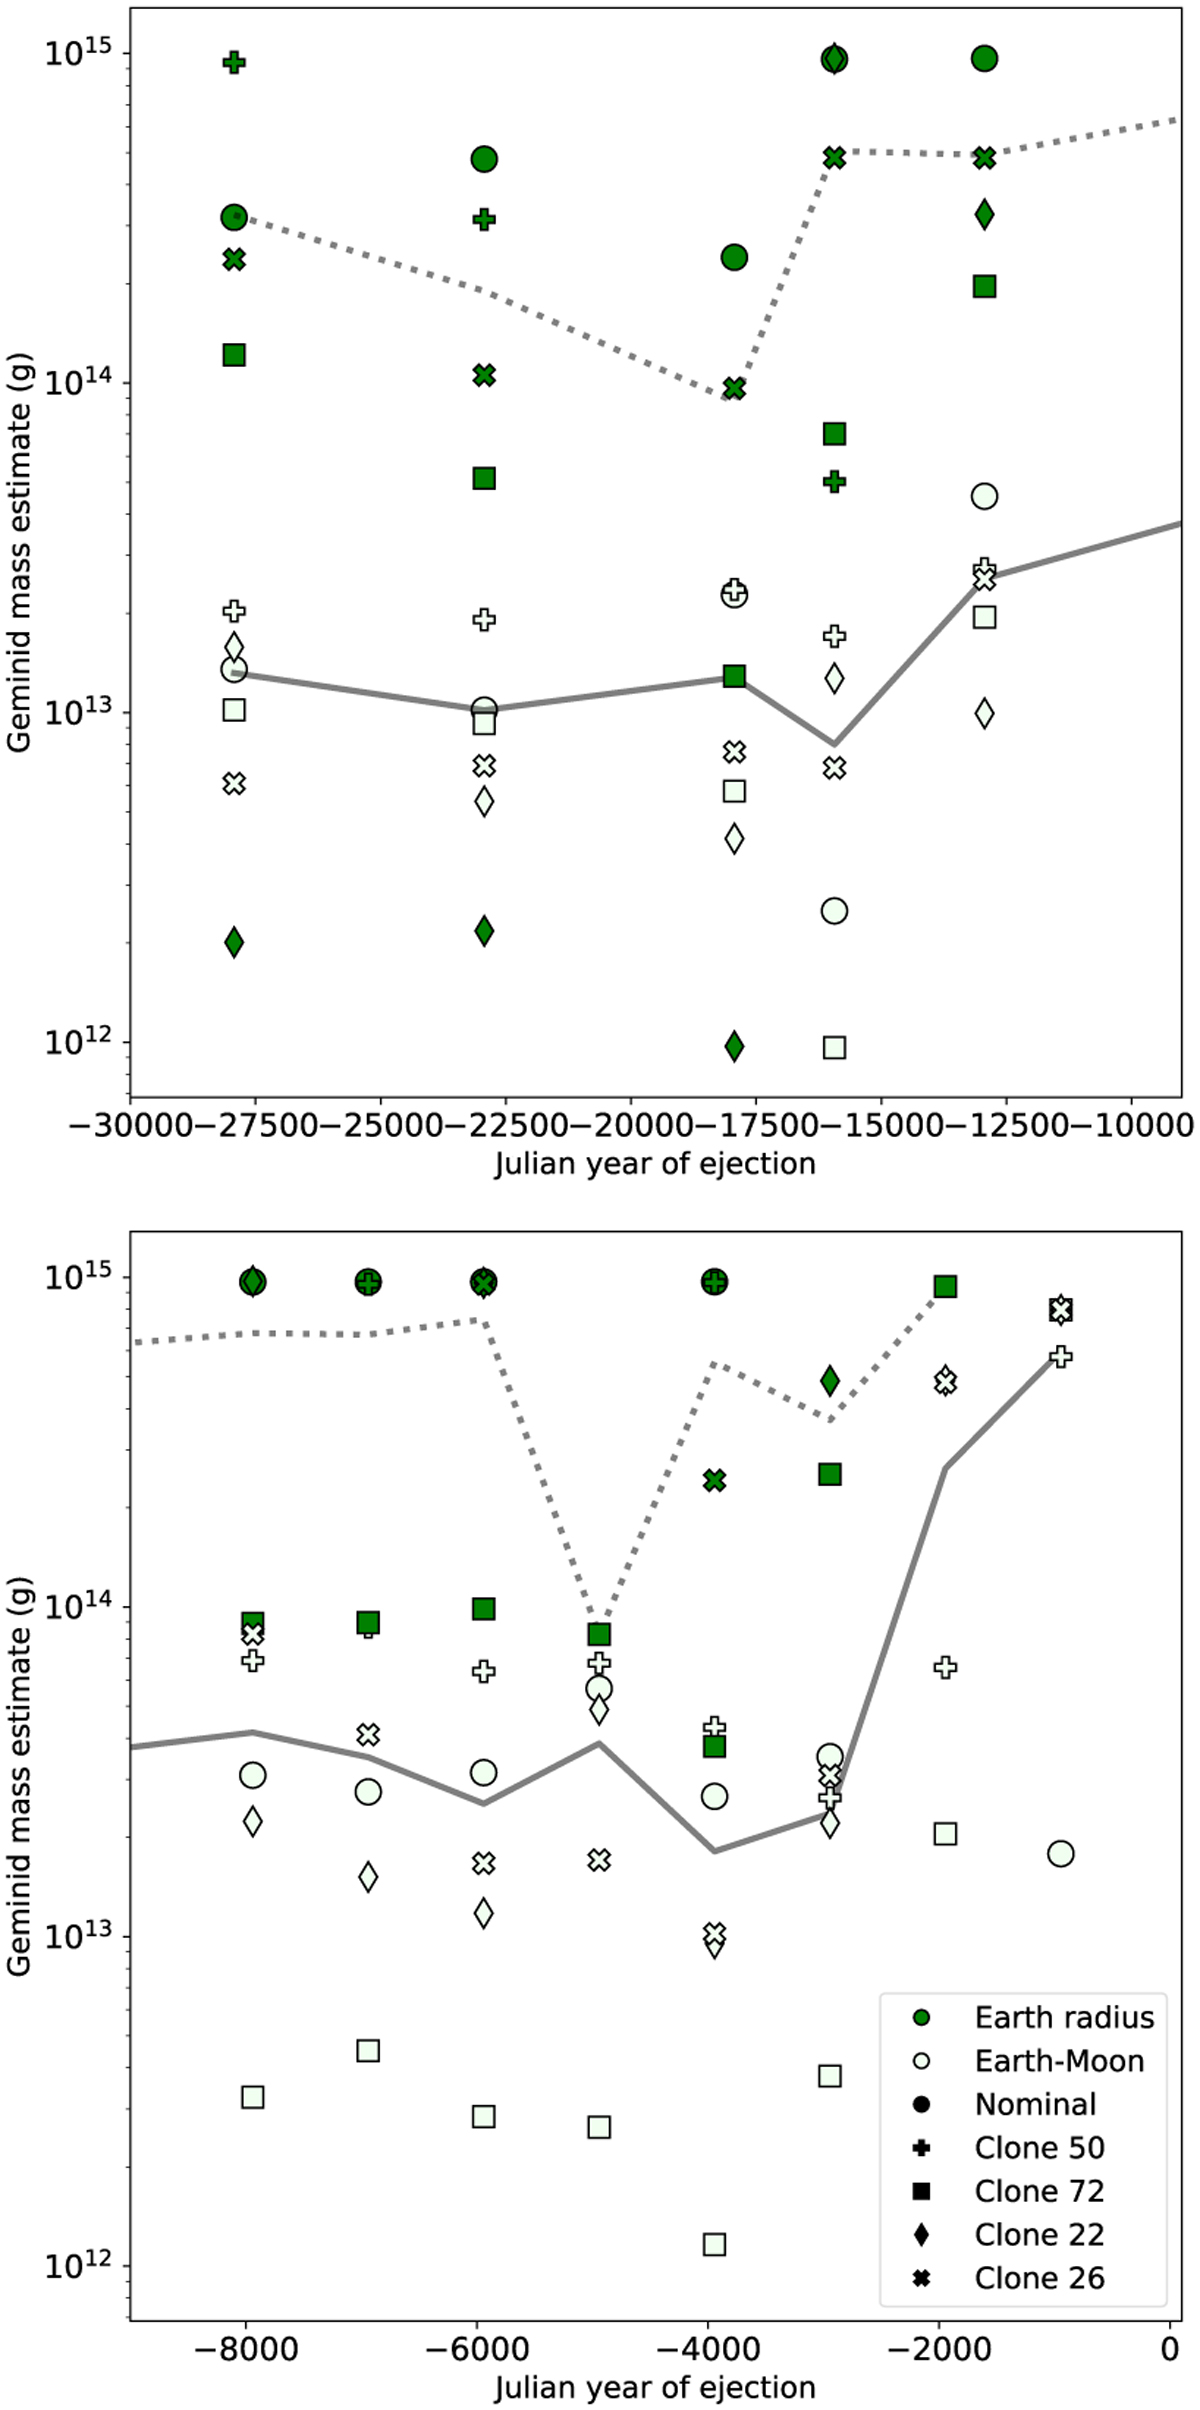
Mass estimate of the Geminid stream for all the simulations performed in this study. The index by Yada et al. (2021) was assumed. The top panel displays data points ranging from ~ 15–30 kyr ago, while the bottom panel shows the values from ~2–10 kyr ago. The letters A and B mark the optimal models chosen in Sect. 4.3.
Current usage metrics show cumulative count of Article Views (full-text article views including HTML views, PDF and ePub downloads, according to the available data) and Abstracts Views on Vision4Press platform.
Data correspond to usage on the plateform after 2015. The current usage metrics is available 48-96 hours after online publication and is updated daily on week days.
Initial download of the metrics may take a while.