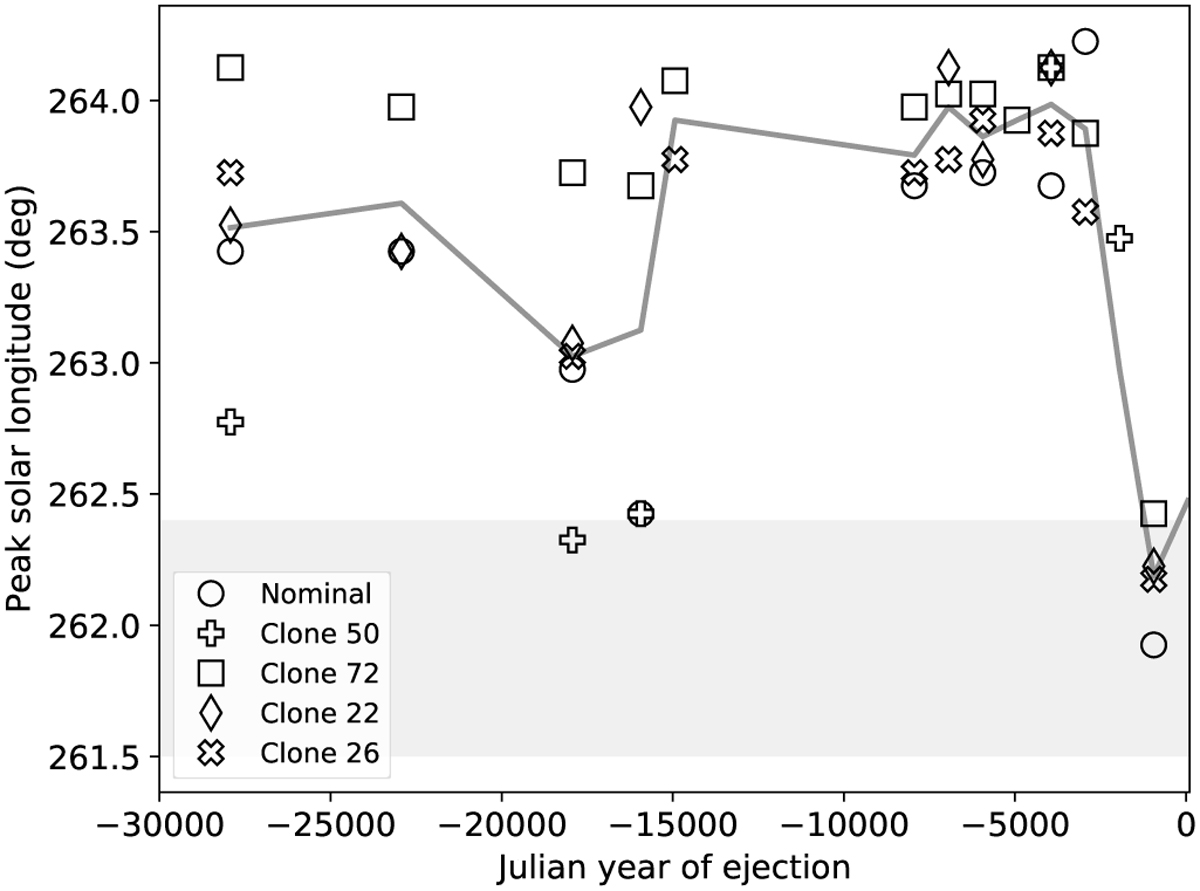
Fig. 6
Download original image
Mode solar longitude of 1-cm particles within the lunar distance MOID criterion. If there was more than one maximum peak, we registered the mean solar longitude of the peaks as the corresponding data point. The blue line is the mean of the data points. The shaded area indicates the maximum activity plateau (261.5–262.4°) reported by Rendtel (2004).
Current usage metrics show cumulative count of Article Views (full-text article views including HTML views, PDF and ePub downloads, according to the available data) and Abstracts Views on Vision4Press platform.
Data correspond to usage on the plateform after 2015. The current usage metrics is available 48-96 hours after online publication and is updated daily on week days.
Initial download of the metrics may take a while.