Fig. 2
Download original image
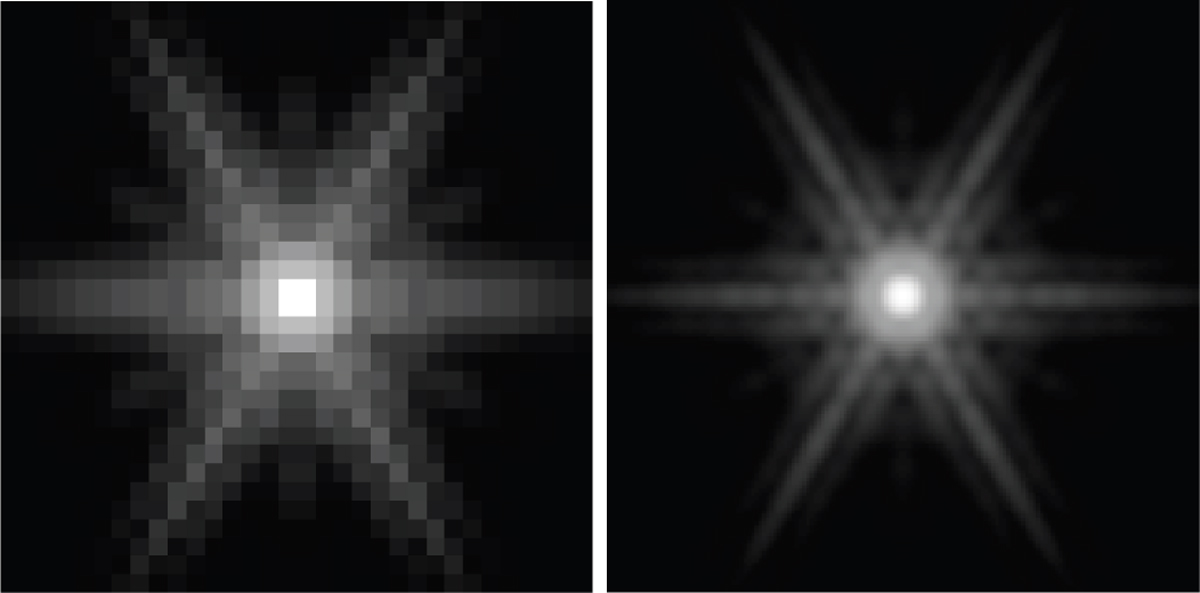
Simulated PSF shown with a logarithmic grayscale. In the left panel, the PSF is drawn on the native 0″.1 scale of Euclid on a 32 × 32 pixel grid. In the right panel, the PSF is first convolved with a 0″.1 filter function and then drawn on a finer 160 × 160 pixel grid with a pixel scale of 0″.02 as used for the measurements with a subsampling factor of five.
Current usage metrics show cumulative count of Article Views (full-text article views including HTML views, PDF and ePub downloads, according to the available data) and Abstracts Views on Vision4Press platform.
Data correspond to usage on the plateform after 2015. The current usage metrics is available 48-96 hours after online publication and is updated daily on week days.
Initial download of the metrics may take a while.