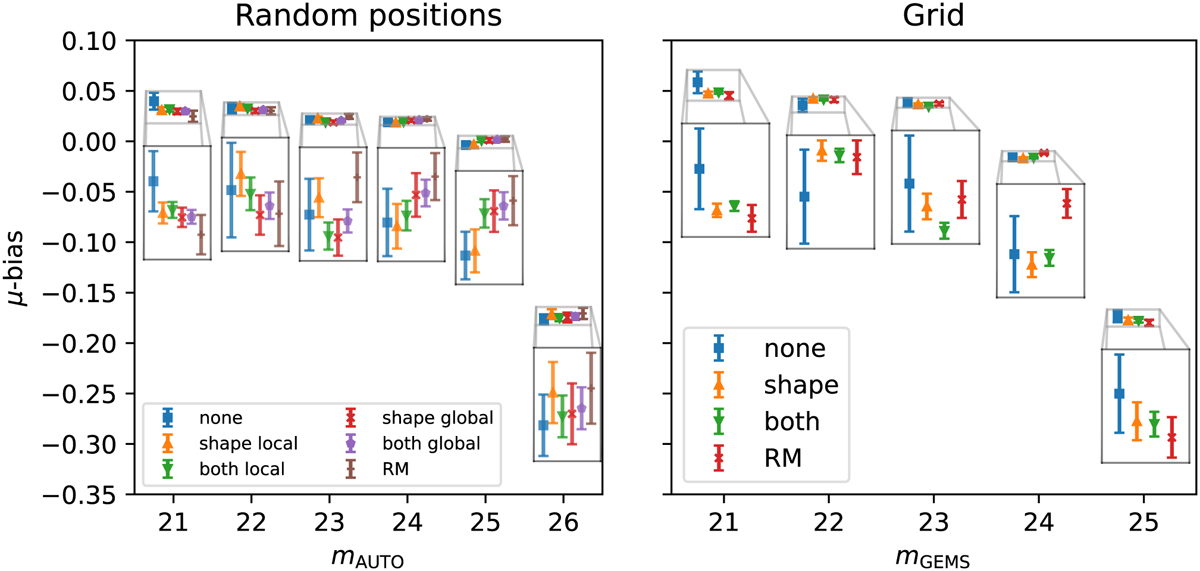
Fig. B.1
Download original image
Absolute multiplicative bias comparison in the large shear interval. The general trend of the multiplicative bias at different magnitudes is presented in the main plot. An additional zoomed version of each magnitude bin is shown to better compare the bias estimates since the error bars are too small to be visible in the main plot. For the left panel, no signal-to-noise cut is applied.
Current usage metrics show cumulative count of Article Views (full-text article views including HTML views, PDF and ePub downloads, according to the available data) and Abstracts Views on Vision4Press platform.
Data correspond to usage on the plateform after 2015. The current usage metrics is available 48-96 hours after online publication and is updated daily on week days.
Initial download of the metrics may take a while.