Fig. 10
Download original image
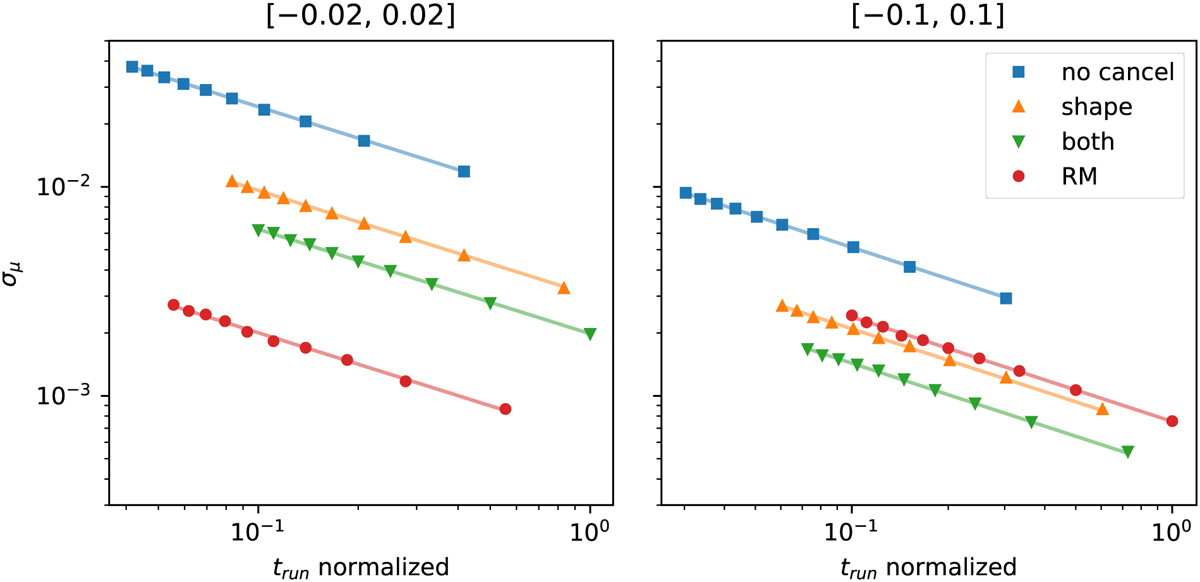
Uncertainty behaviour for the different methods for grid-based simulations. The runtime, which is used here, is always the theoretical runtime from Sect. 4.2 normalised to its maximum value in the respective figure. Here the large shear interval is normalised to a theoretical runtime of 13.2 × 10⁶ and the small shear interval to 14.4 × 10⁶, respectively. Solid lines show fits to the data described in Sect. 6.3. The left and right panels differ by the used shear interval, which is indicated in each column title.
Current usage metrics show cumulative count of Article Views (full-text article views including HTML views, PDF and ePub downloads, according to the available data) and Abstracts Views on Vision4Press platform.
Data correspond to usage on the plateform after 2015. The current usage metrics is available 48-96 hours after online publication and is updated daily on week days.
Initial download of the metrics may take a while.