Fig. 9.
Download original image
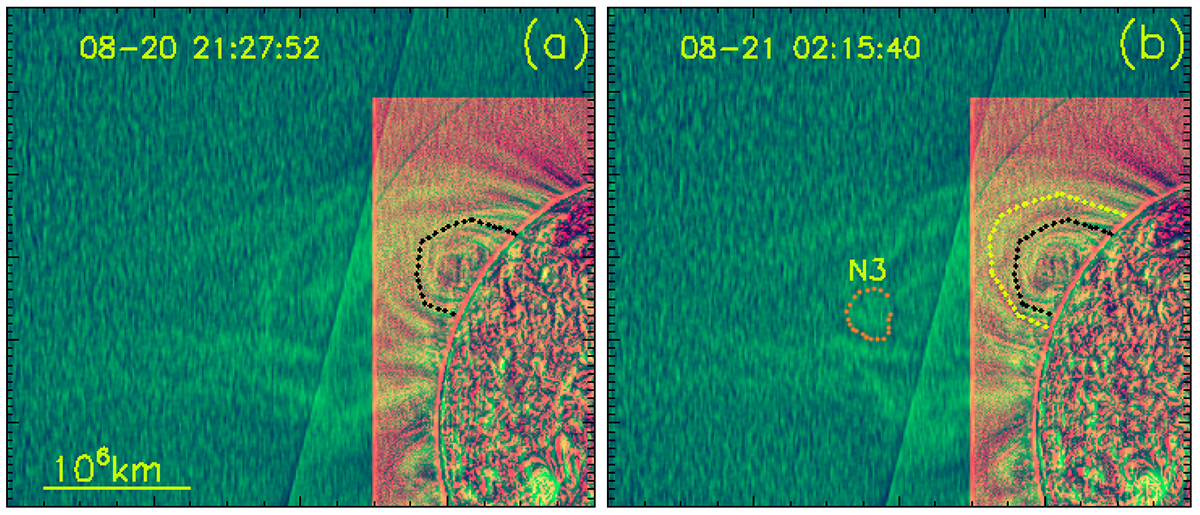
Birth of “N3” (enclosed by the dotted red line in panel b) and expansion of low-lying loops seen in the combined SUVI and AIA images. The dotted black lines denote the location of the loop seen in the AIA image at 21:27 UT on August 20 and the dotted yellow line marks that at 02:15 UT on August 21. An associated animation is given online.
Current usage metrics show cumulative count of Article Views (full-text article views including HTML views, PDF and ePub downloads, according to the available data) and Abstracts Views on Vision4Press platform.
Data correspond to usage on the plateform after 2015. The current usage metrics is available 48-96 hours after online publication and is updated daily on week days.
Initial download of the metrics may take a while.