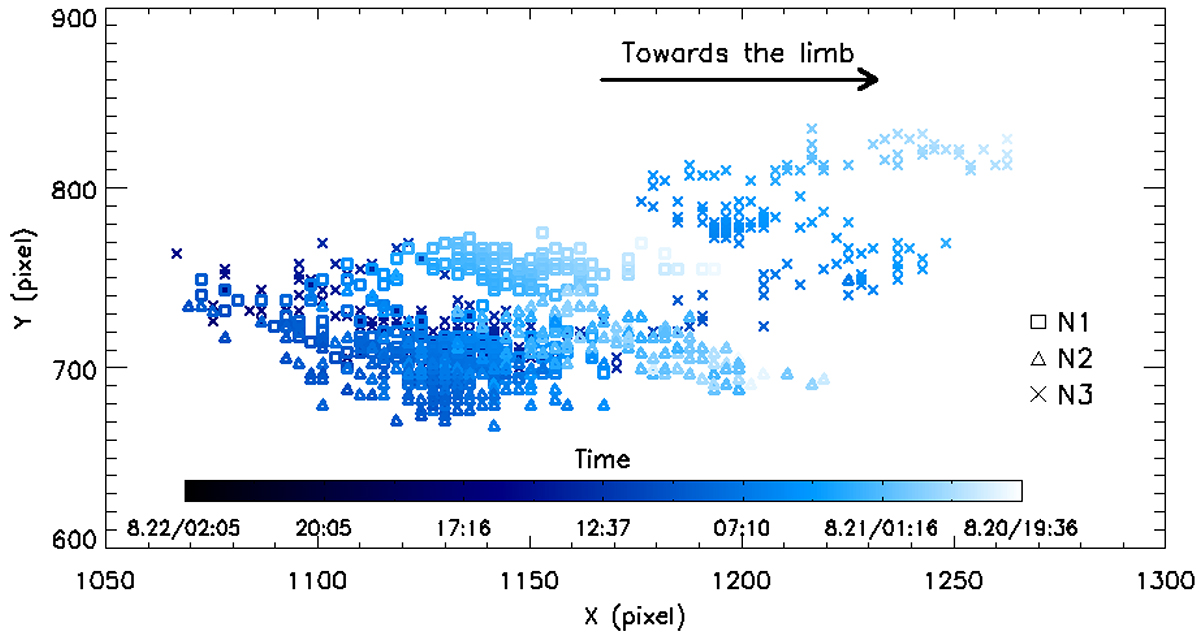
Fig. 7.
Download original image
Variations in the centers (on the projected X − Y plane) of the three clumps of brightenings. The squares, triangles, and crosses are the locations of “N1”, “N2”, and “N3”, respectively. The change in time is shown as a change in color. The convergence of the three clumps can be followed in this diagram while they are moving toward the same position at the end.
Current usage metrics show cumulative count of Article Views (full-text article views including HTML views, PDF and ePub downloads, according to the available data) and Abstracts Views on Vision4Press platform.
Data correspond to usage on the plateform after 2015. The current usage metrics is available 48-96 hours after online publication and is updated daily on week days.
Initial download of the metrics may take a while.