Fig. 6.
Download original image
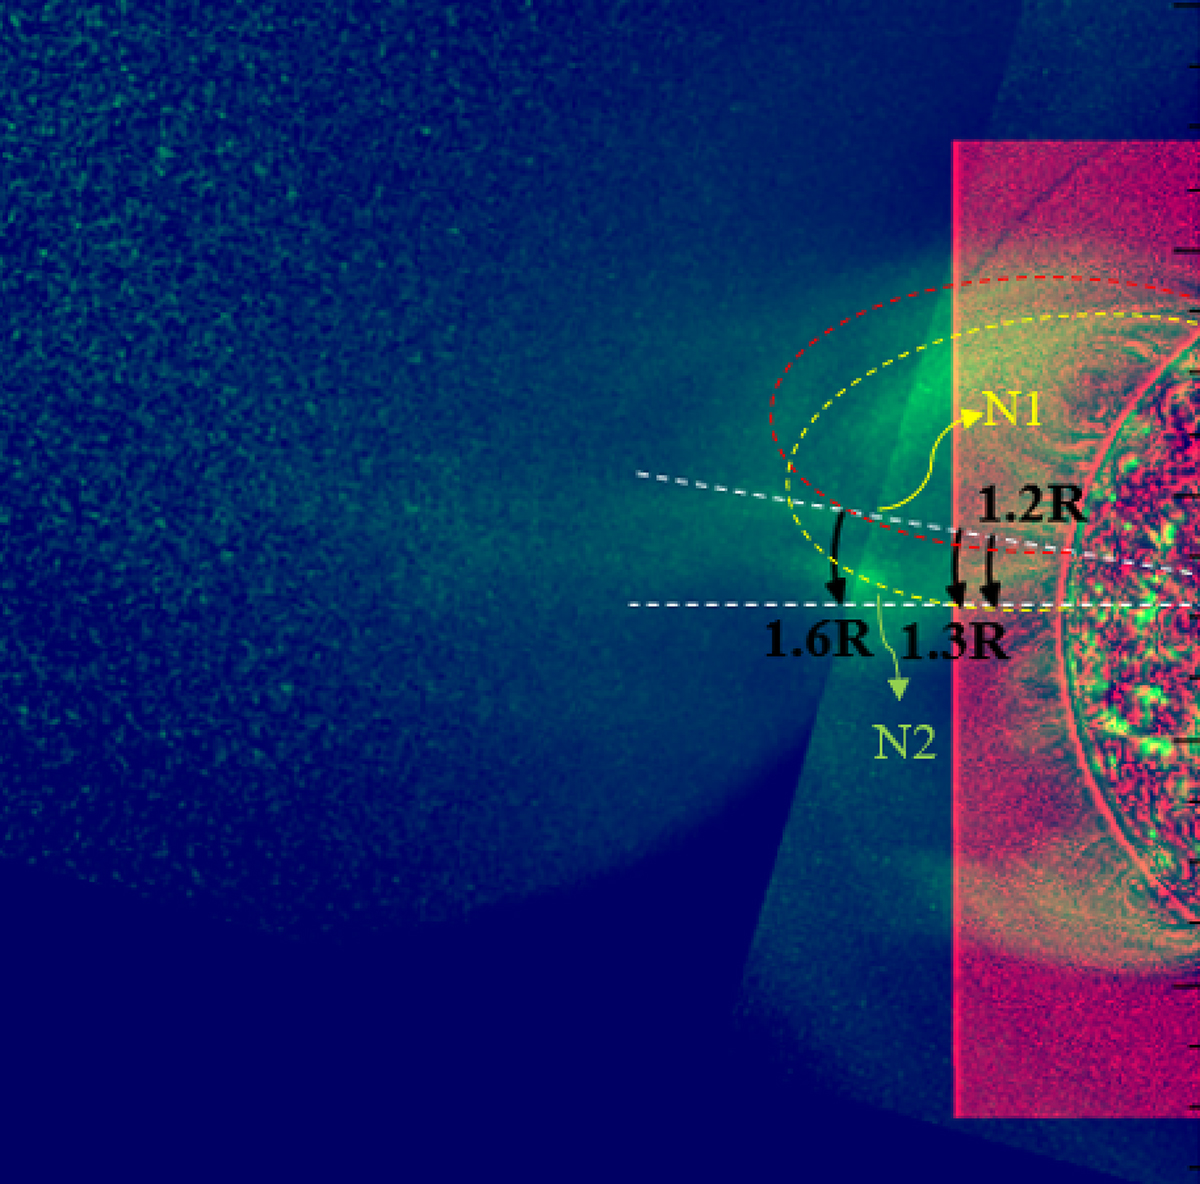
Combined image of SUVI 195 Å image and AIA 193 Å image. The dashed red and yellow lines mark the loops associated with N1 and N2, respectively. Three slits at 1.2 R⊙, 1.3 R⊙, and 1.6 R⊙ where we obtained distance-time maps (shown in Fig. 8) are marked as black arrows (0 is given at the tail end). These slits are arranged roughly in the same opening angle. We note that the elongated structures are not perfectly aligned in the radial direction. An associated animation is given online.
Current usage metrics show cumulative count of Article Views (full-text article views including HTML views, PDF and ePub downloads, according to the available data) and Abstracts Views on Vision4Press platform.
Data correspond to usage on the plateform after 2015. The current usage metrics is available 48-96 hours after online publication and is updated daily on week days.
Initial download of the metrics may take a while.