Open Access
Fig. 5.
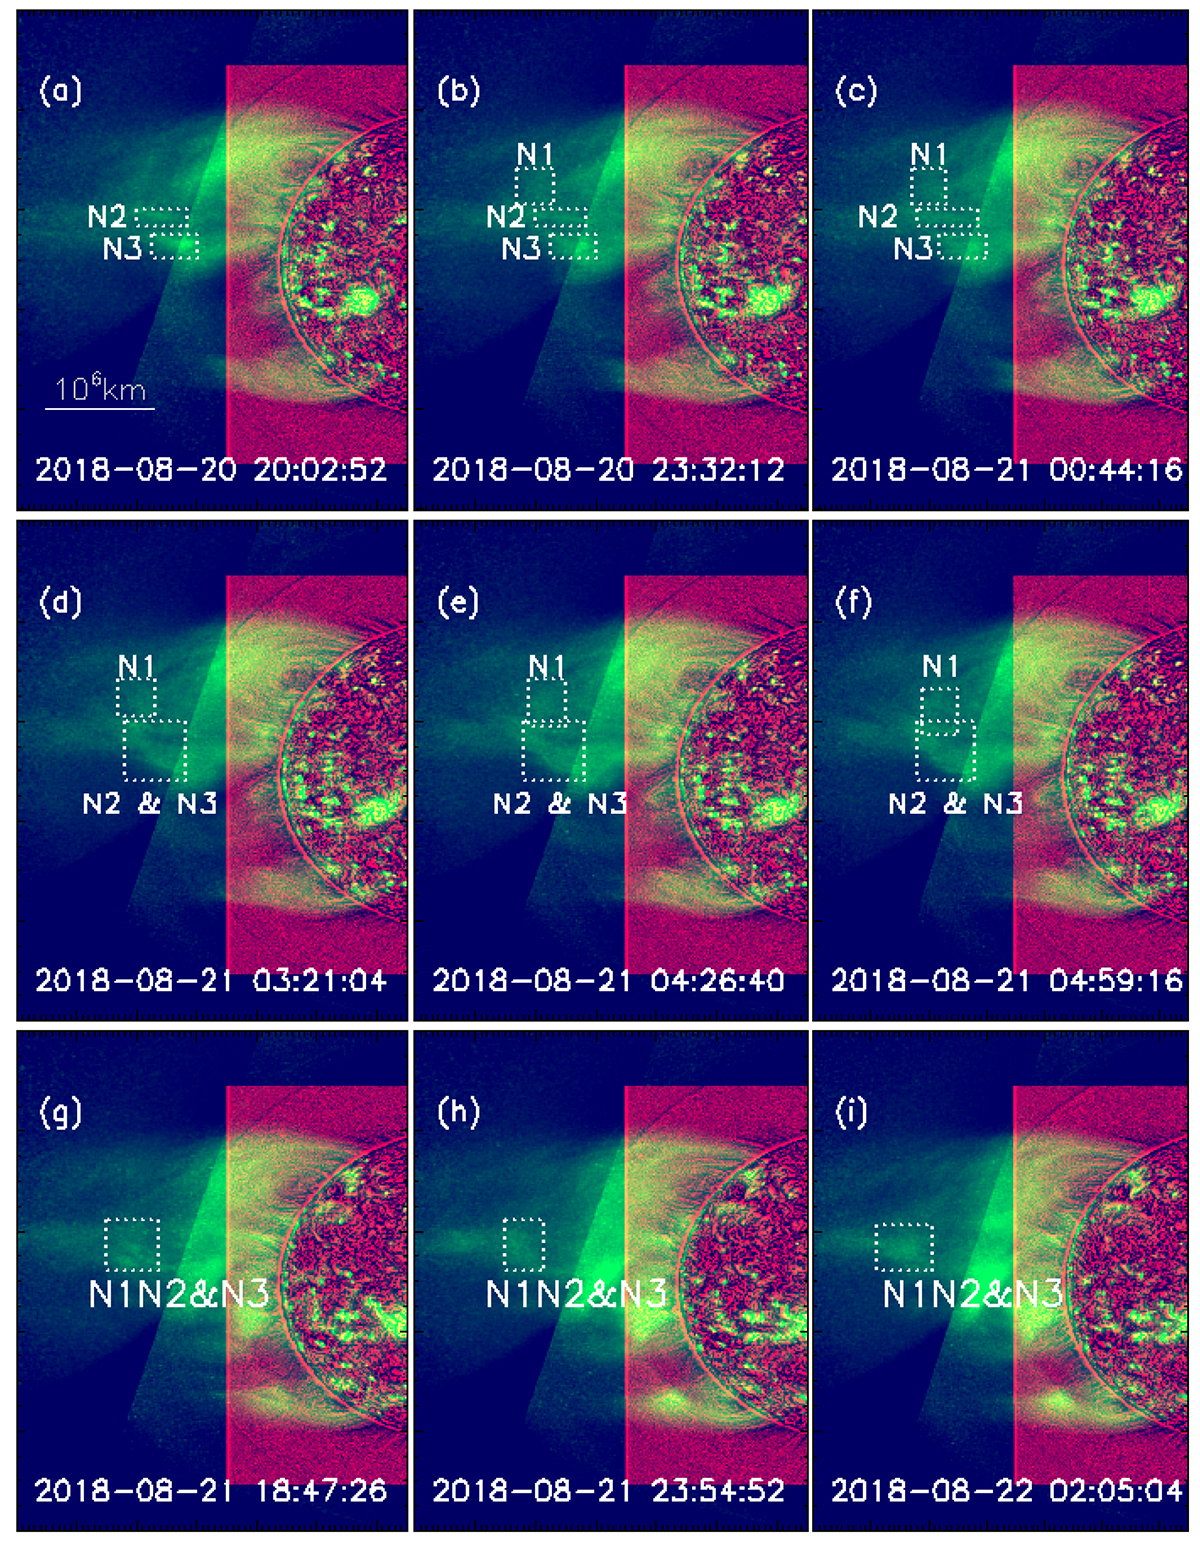
Download original image
Evolution of the solar corona seen in combined observations of AIA 193 Å (red) and SUVI 195 Å (green). The regions enclosed by dotted lines denote three clumps of brightenings (N1, N2, and N3), and their merging processes can be followed.
Current usage metrics show cumulative count of Article Views (full-text article views including HTML views, PDF and ePub downloads, according to the available data) and Abstracts Views on Vision4Press platform.
Data correspond to usage on the plateform after 2015. The current usage metrics is available 48-96 hours after online publication and is updated daily on week days.
Initial download of the metrics may take a while.