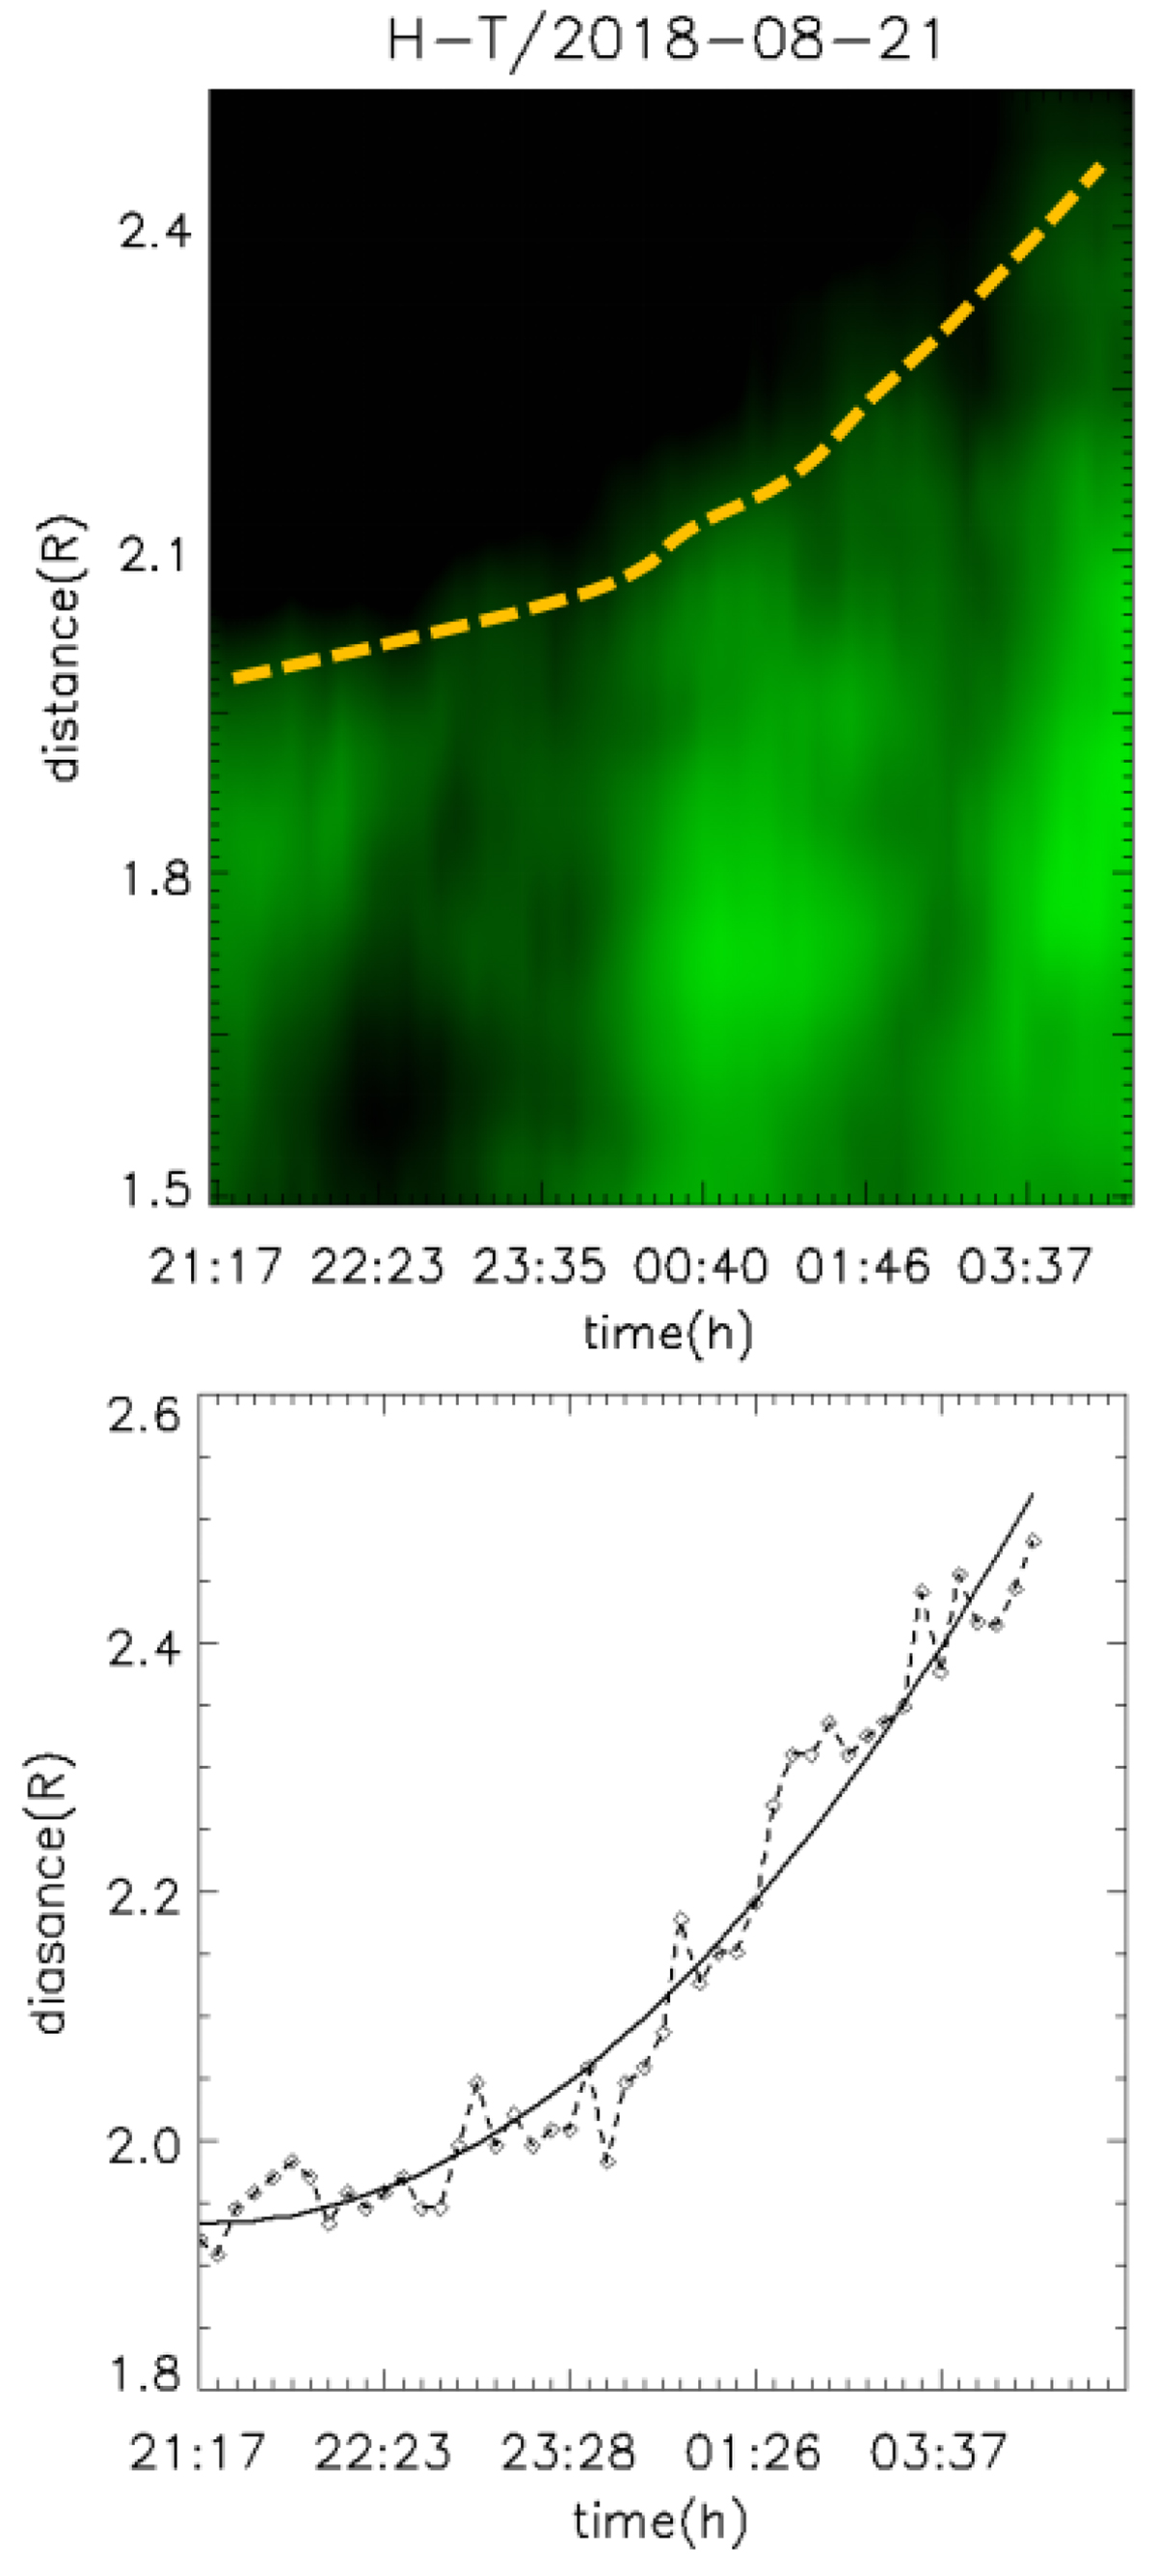
Fig. 4.
Download original image
Top: time-distance map following the expansion of the bright elongated feature in the SUVI images (the time coordinate starts from 21:17 UT on August 21). The blob presents as the tip of the expanding feature, which can be tracked by the dashed gold line. Bottom: variation in the height of the blob seen in SUVI images (diamonds with a dashed line), which was identified manually. The solid line is a second-order polynomial fit to the variation curve.
Current usage metrics show cumulative count of Article Views (full-text article views including HTML views, PDF and ePub downloads, according to the available data) and Abstracts Views on Vision4Press platform.
Data correspond to usage on the plateform after 2015. The current usage metrics is available 48-96 hours after online publication and is updated daily on week days.
Initial download of the metrics may take a while.