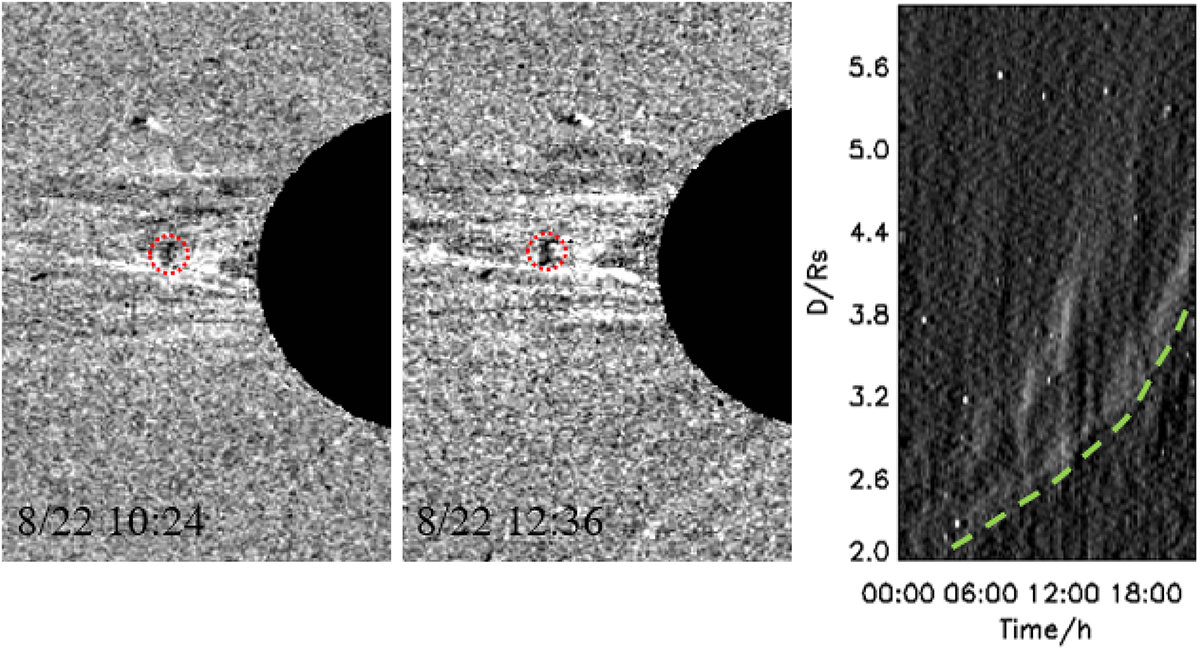
Fig. 2.
Download original image
Left and middle panels: running difference images obtained from LASCO C2 observations at 10:24 UT and 12:36 UT on August 22, in which a small propagating blob is shown as a structure with dark center surrounded by bright features (marked by circles in dashed red lines). Right panel: a time-distance map tracking the propagation of the streamer blob in the running difference images. The time starts at 00:00 UT on August 22. The dashed green line denotes the propagation of the streamer blob, from which the tangent derives its propagating speeds. An associated animation is given online.
Current usage metrics show cumulative count of Article Views (full-text article views including HTML views, PDF and ePub downloads, according to the available data) and Abstracts Views on Vision4Press platform.
Data correspond to usage on the plateform after 2015. The current usage metrics is available 48-96 hours after online publication and is updated daily on week days.
Initial download of the metrics may take a while.