Fig. 10.
Download original image
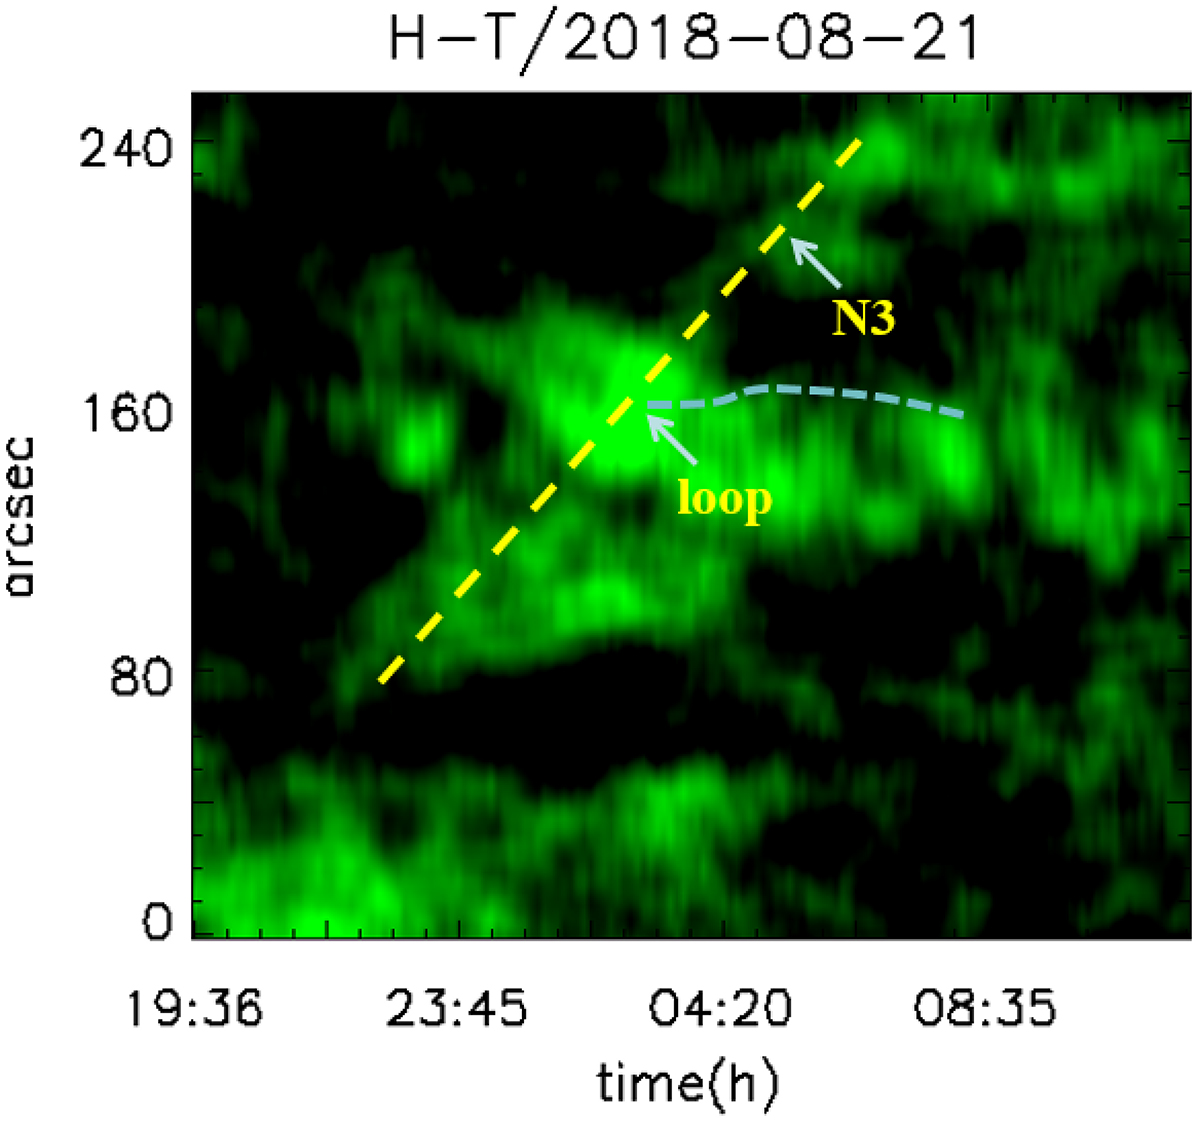
Time–distance map obtained along the expanding direction of the loop system and the propagation of “N3”. The blue arrow indicates the time and location when and where “N3” is pinching off. The dashed yellow line shows the expansion of the loop system and the fall of “N3”. The dashed cyan line indicates the retraction of the loop system.
Current usage metrics show cumulative count of Article Views (full-text article views including HTML views, PDF and ePub downloads, according to the available data) and Abstracts Views on Vision4Press platform.
Data correspond to usage on the plateform after 2015. The current usage metrics is available 48-96 hours after online publication and is updated daily on week days.
Initial download of the metrics may take a while.