Fig. 4
Download original image
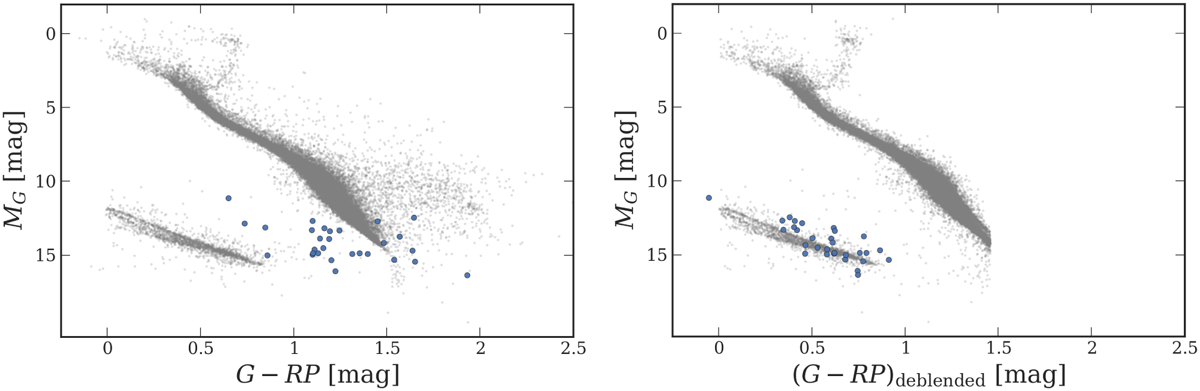
Difference between the measured and de-blended G – RP colours for the identified white dwarfs and their location on the CMD. For comparison, the 50 pc Gaia DR3 sample is shown in the background (grey points); only objects with BP – RP colours in the range 0.0 mag < BP – RP < 4.25 mag (the applicability range of the de-blending correction) are plotted. Left: CMD using the published G – RP colour. Right: CMD for the same sample, but using de-blended G – RP colour.
Current usage metrics show cumulative count of Article Views (full-text article views including HTML views, PDF and ePub downloads, according to the available data) and Abstracts Views on Vision4Press platform.
Data correspond to usage on the plateform after 2015. The current usage metrics is available 48-96 hours after online publication and is updated daily on week days.
Initial download of the metrics may take a while.