Fig. 1
Download original image
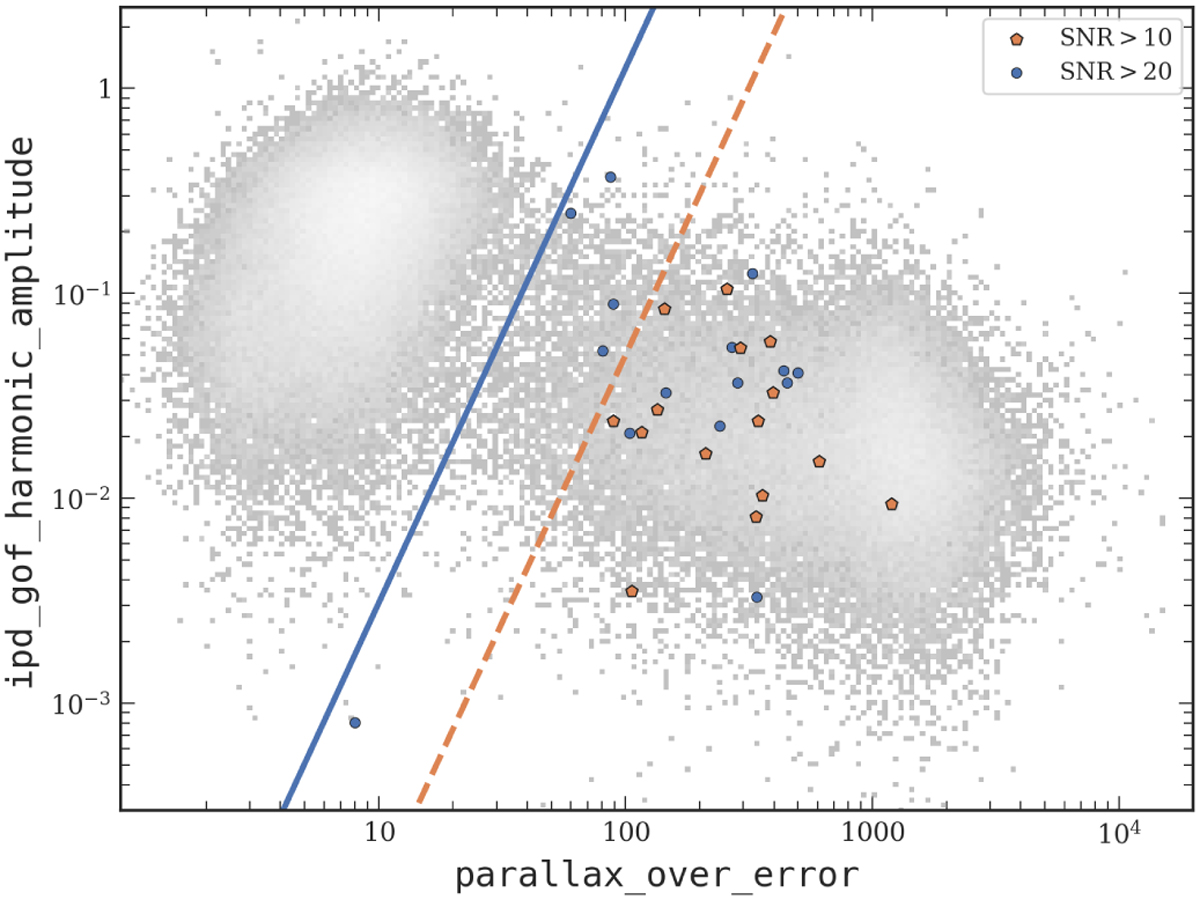
Amplitude of angular variation in the IPD GoF as a function of |ϖ/σϖ| for white dwarfs in this work (blue and orange symbols). The blue line corresponds to Eq. (2); the orange dashed line corresponds to the cut defined in Eq. (4)-(iv) to select objects with lower S/N in photometry (orange pentagons). For comparison, the 50 pc Gaia DR3 sample is shown in the background (grey symbols).
Current usage metrics show cumulative count of Article Views (full-text article views including HTML views, PDF and ePub downloads, according to the available data) and Abstracts Views on Vision4Press platform.
Data correspond to usage on the plateform after 2015. The current usage metrics is available 48-96 hours after online publication and is updated daily on week days.
Initial download of the metrics may take a while.