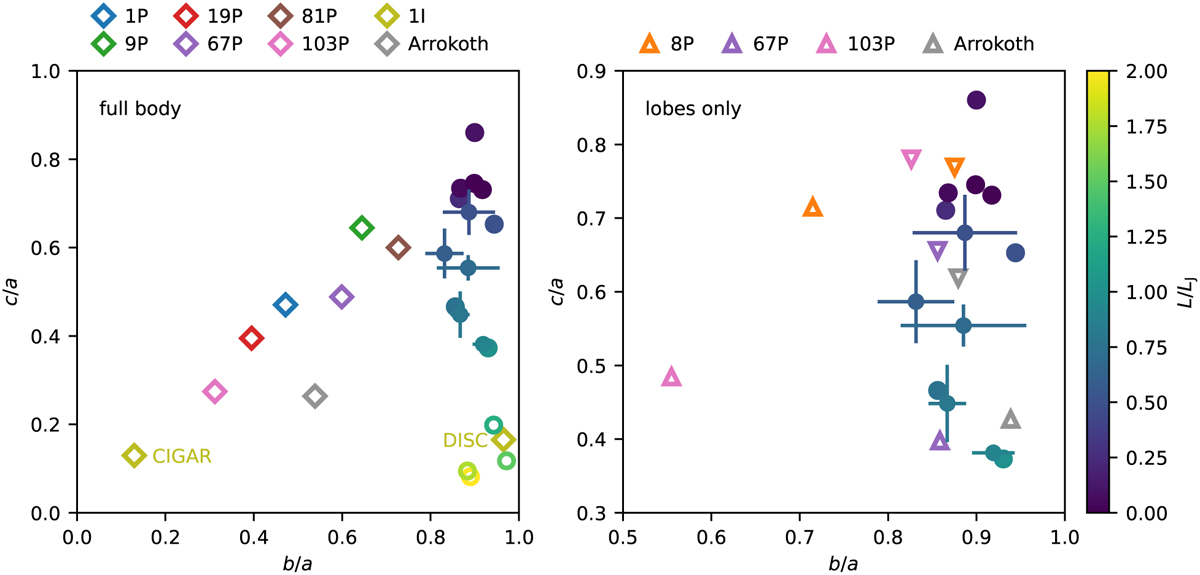
Fig. 5
Download original image
Axes ratios of Solar System bodies, ‘Oumuamua, and simulated planetesimals. The simulated planetesimals are shown as circles with a colour that indicates the initial angular momentum of the pebble cloud L/LJ. For L/LJ > 1, we used open symbols. The data points with error bars are from simulations where we averaged over five runs with varying random seed. The Solar System bodies and ‘Oumuamua are shown with open diamond symbols and different colours: 1P/Halley (blue), 8P/Tuttle (orange), 9P/Tempel 1 (green), 19P/Borrelly (red), 67P/Churyumov-Gerasimenko (purple), 81P/Wild 2 (brown), 103P/Hartley 2 (pink), Arrokoth (grey), 1I/2017 U1 (‘Oumuamua) (olive). Left: axes ratios of the whole bodies. Right: axes ratios of the individual lobes of the bilobed and contact-binary comets, Arrokoth, and the simulated planetesimals. We plot the axes ratios of the individual lobes with an upper triangle for the big lobe and a lower triangle for the small lobe. For Hartley 2, we included the two lobes that we found from analysing the shape model (see Appendix D).
Current usage metrics show cumulative count of Article Views (full-text article views including HTML views, PDF and ePub downloads, according to the available data) and Abstracts Views on Vision4Press platform.
Data correspond to usage on the plateform after 2015. The current usage metrics is available 48-96 hours after online publication and is updated daily on week days.
Initial download of the metrics may take a while.