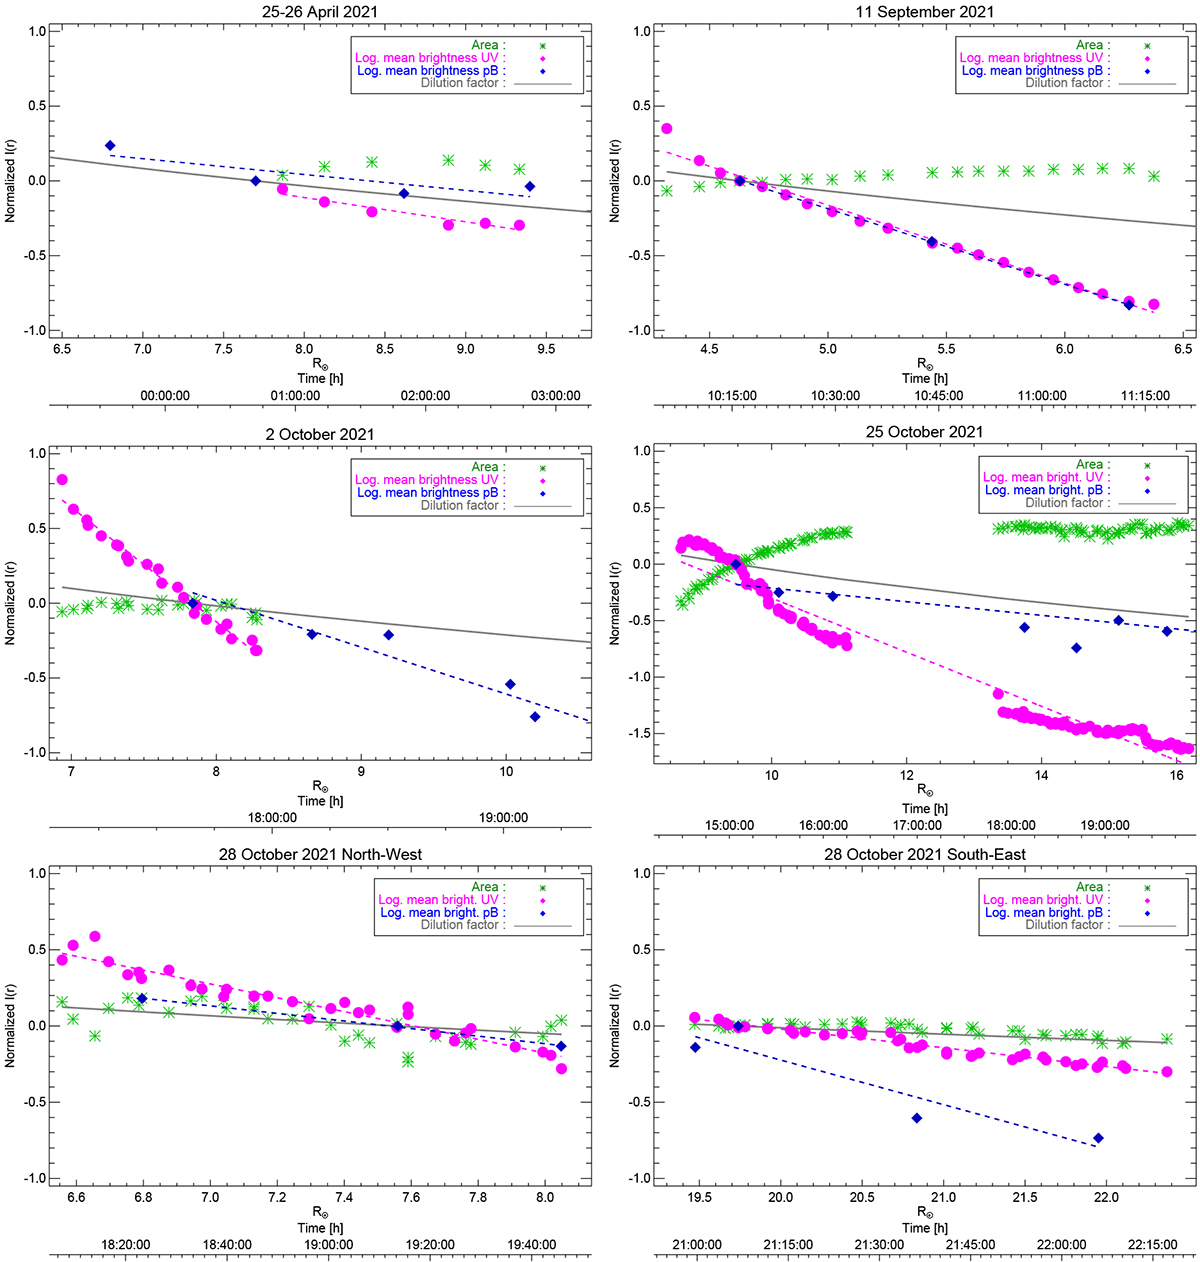
Fig. 19.

Download original image
Normalized UV and visible light radiances as a function of solar radii and time. Each panel in temporal order displays: green stars, representing the area of UV structures as a function of radial distance (de-projected) in solar radii and time in hours (UT); magenta points, representing the mean UV H I Ly-α intensities of the selected areas for each frame in physical units of ph cm−2 s−1 sr−1; blue diamond points, representing the mean brightness of the pB base difference at the pixel position containing the maximum intensity of UV structures for the available frames in physical units of ph cm−2 s−1 sr−1; gray solid lines, representing the dilution factor. All quantities are normalized to zero at a reference solar radius, shown in the fourth column of Table 2. Dashed lines represent a linear fit to UV and pB intensity profiles. Estimated parameters from the fit are reported in Table 2.
Current usage metrics show cumulative count of Article Views (full-text article views including HTML views, PDF and ePub downloads, according to the available data) and Abstracts Views on Vision4Press platform.
Data correspond to usage on the plateform after 2015. The current usage metrics is available 48-96 hours after online publication and is updated daily on week days.
Initial download of the metrics may take a while.


