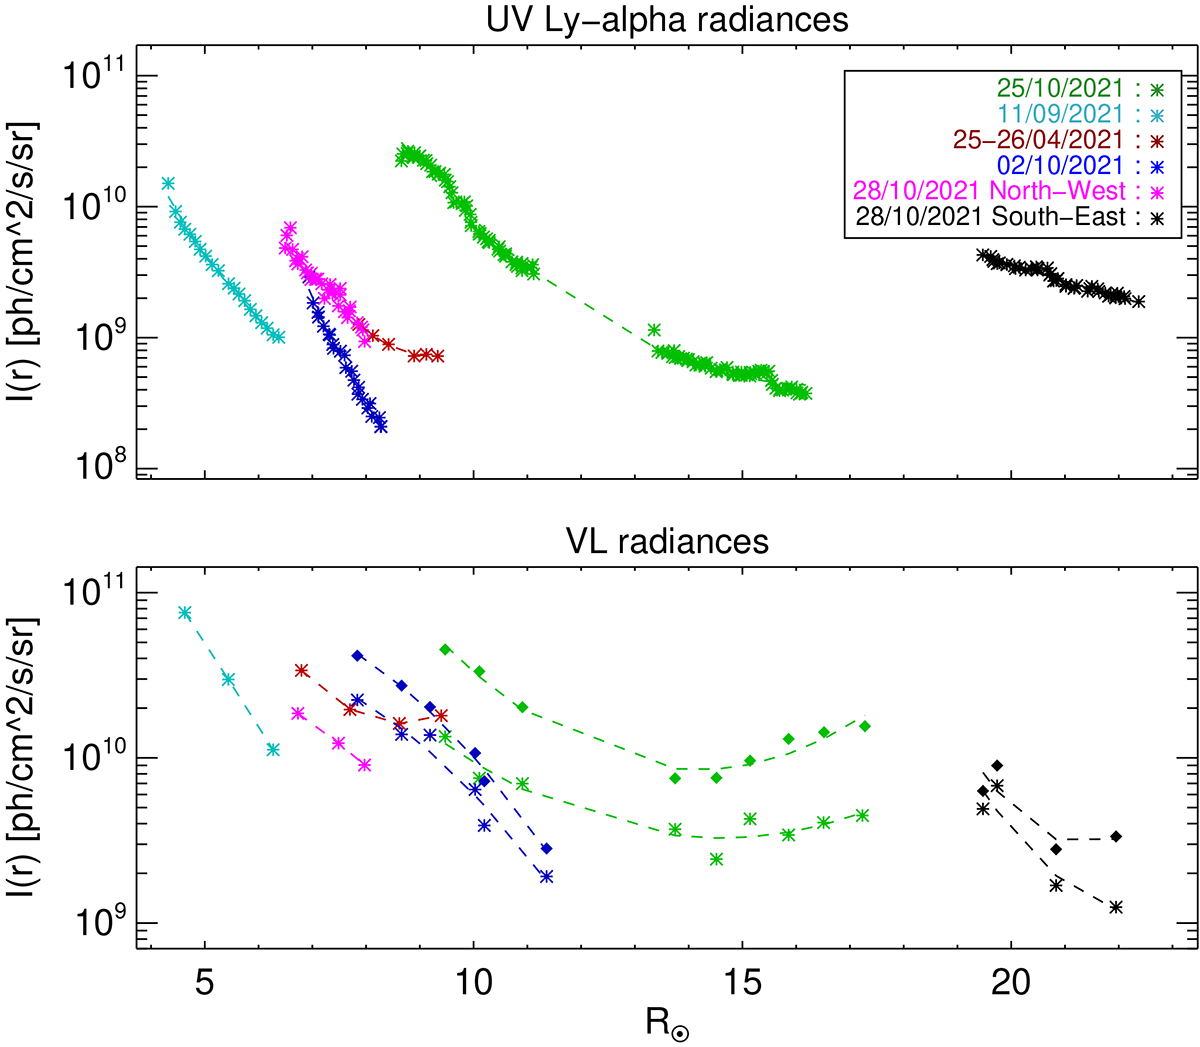
Fig. 18.

Download original image
UV and visible light radiances as a function of solar radii. Top panel: mean UV Ly-α intensity within the area of the observed structures selected for each frame as described in the text (Sect. 4.2). Bottom panel: peak of brightness in the base difference of polarized signal (indicated by stars) and total brightness (indicated by diamonds) at the position corresponding to the highest luminosity peak within the structure area in the respective UV frames (see Sect. 4.2). Both panels: dashed lines are a quadratic fit to the shown mean radiance as function of de-projected radial distance.
Current usage metrics show cumulative count of Article Views (full-text article views including HTML views, PDF and ePub downloads, according to the available data) and Abstracts Views on Vision4Press platform.
Data correspond to usage on the plateform after 2015. The current usage metrics is available 48-96 hours after online publication and is updated daily on week days.
Initial download of the metrics may take a while.


