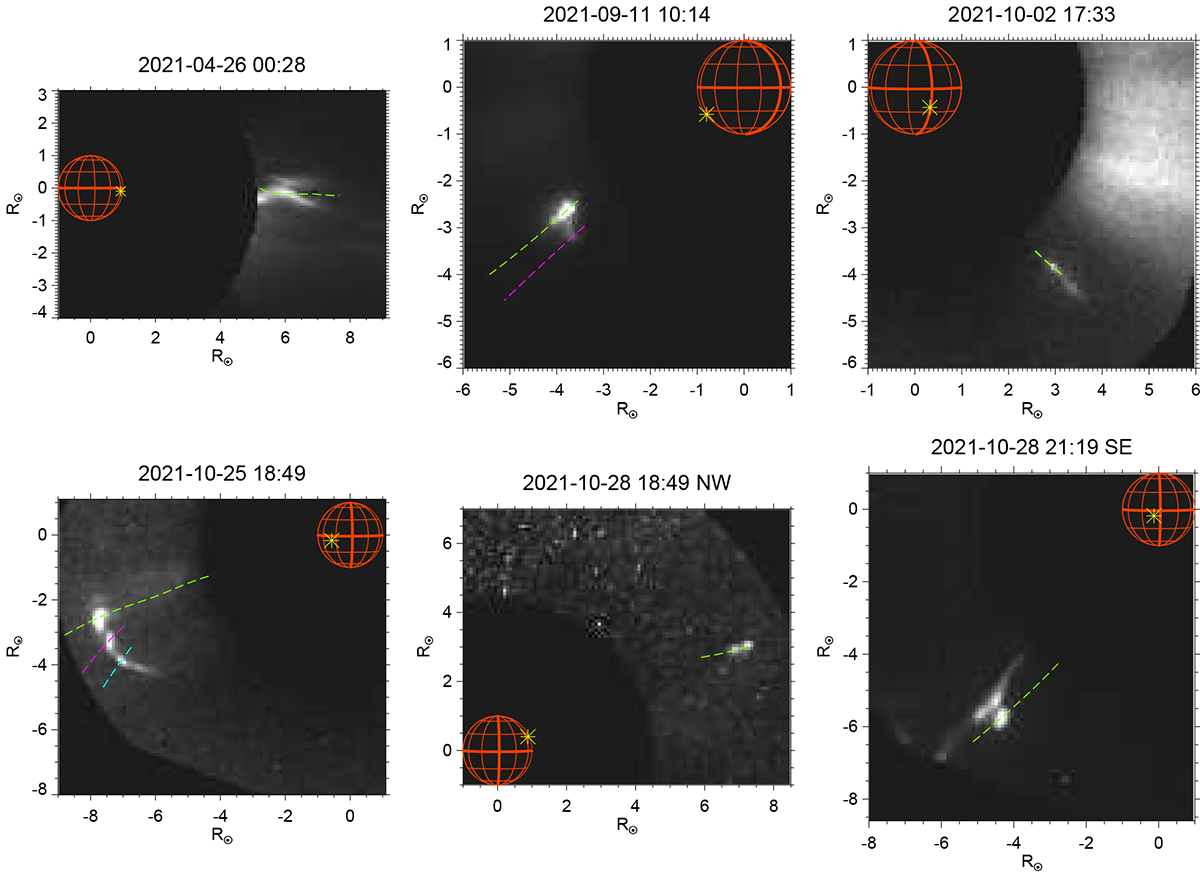
Fig. 17.

Download original image
Overview of the eruptive events. For each event, we show one Metis UV frame identified by the date in the title, where the bright feature is visible. All the frames are taken at the reference time in column two of Table 4, except for October 25, for which we chose a frame that shows the evolution of the three bright components of the structure. The green dashed lines are the trajectory of the trailing features in all the available UV frames used to trace the position as a function of time. Other colored dashed lines trace different features of the structures, helping in visualizing the evolution of their angular width. The yellow stars derive from the projection of the Carrington coordinates in columns seven and eight of Table 1 on the Metis plane of sky and extrapolated at the Sun’s surface.
Current usage metrics show cumulative count of Article Views (full-text article views including HTML views, PDF and ePub downloads, according to the available data) and Abstracts Views on Vision4Press platform.
Data correspond to usage on the plateform after 2015. The current usage metrics is available 48-96 hours after online publication and is updated daily on week days.
Initial download of the metrics may take a while.


