Fig. D.1
Download original image
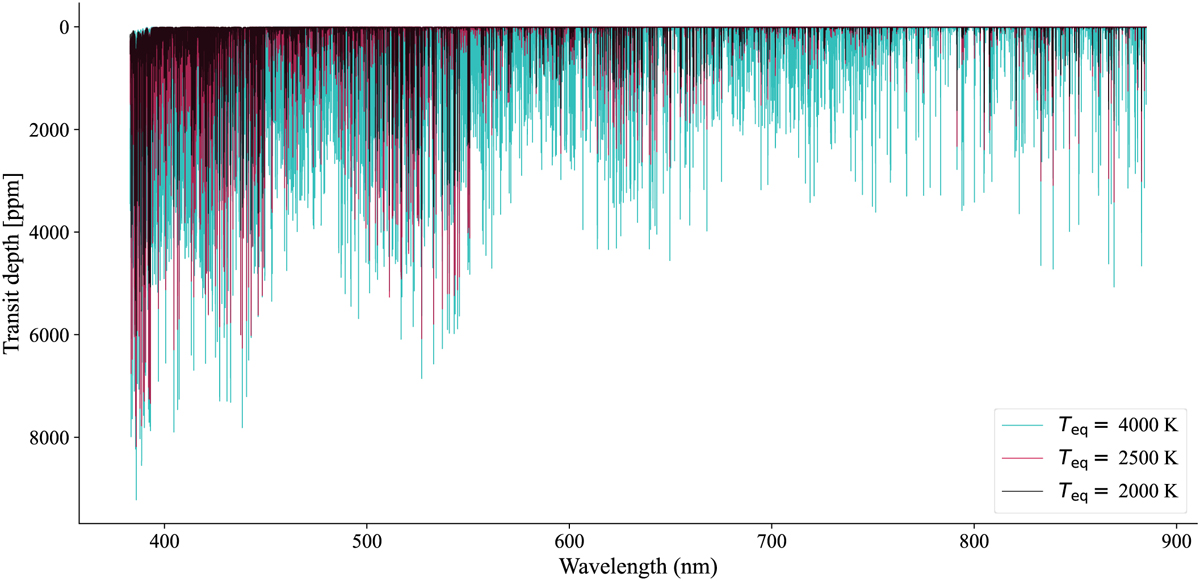
Variation in Fe I transmission with temperature. The plot illustrates three Fe I transmission templates used to emulate the transits. The 4000K template is represented in blue, the 2500 K template in red, and the 2000 K template in black. A discernible trend of increasing transmission depths is observed with escalating temperature, wherein more lines become pronounced and stronger. This enhancement in line strength with temperature increment effectively introduces more structure to the auto-correlation function, elucidating the temperature-dependent behaviour of Fe I transmission in the emulation of transits.
Current usage metrics show cumulative count of Article Views (full-text article views including HTML views, PDF and ePub downloads, according to the available data) and Abstracts Views on Vision4Press platform.
Data correspond to usage on the plateform after 2015. The current usage metrics is available 48-96 hours after online publication and is updated daily on week days.
Initial download of the metrics may take a while.