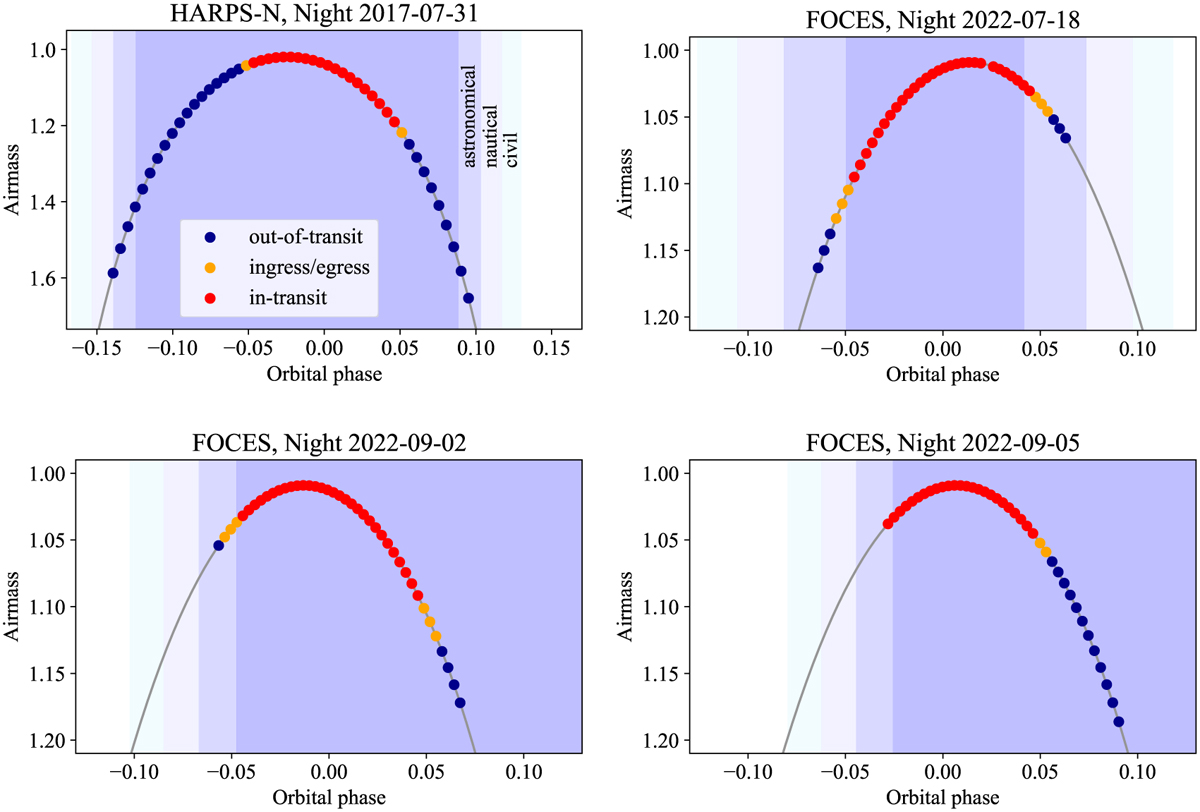
Fig. B.1
Download original image
Airmass plots for KELT-9 b observations. Each data point represents an individual exposure frame. In-transit, ingress/egress, and out-of-transit exposures are indicated with red, orange, and blue. The civil, nautical, and astronomical twilight phases are indicated by the blue shaded regions. All transits were observed at low airmass. Parts of the transits observed with FOCES occurred during astronomical twilight given the short duration of the nights in summer.
Current usage metrics show cumulative count of Article Views (full-text article views including HTML views, PDF and ePub downloads, according to the available data) and Abstracts Views on Vision4Press platform.
Data correspond to usage on the plateform after 2015. The current usage metrics is available 48-96 hours after online publication and is updated daily on week days.
Initial download of the metrics may take a while.