Fig. 4
Download original image
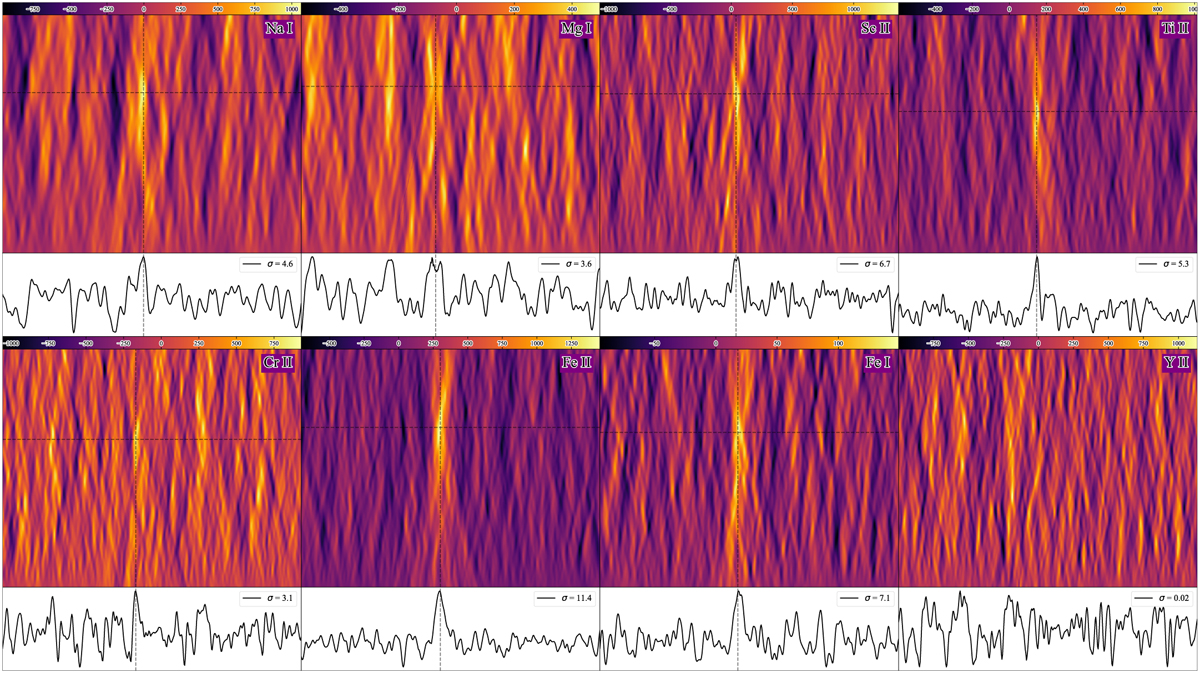
Cross-correlation results for the combined FOCES observations across the eight species investigated. Ordered left to right, then top to bottom are: Na I, Mg I, Sc II, Ti II, Cr II, Fe II, Fe I, and Y II. The top panels of each detection contain the KpVsys maps. The cross-hairs locate the points where the signal peak has been extracted, and the bottom plots show the one-dimensional cross-correlation slice after extracting the rows containing the peak. The detection significance (σ) is indicated in the legend. We have managed to successfully recover seven of the eight detections reported in Hoeijmakers et al. (2019). Only Y II has not been recovered, but it is known to be a weak signal and difficult for the HARPS-N spectrograph to resolve. While the signals are present in most plots they exhibit a strong degree of noise, indicative of using a 2 m class telescope.
Current usage metrics show cumulative count of Article Views (full-text article views including HTML views, PDF and ePub downloads, according to the available data) and Abstracts Views on Vision4Press platform.
Data correspond to usage on the plateform after 2015. The current usage metrics is available 48-96 hours after online publication and is updated daily on week days.
Initial download of the metrics may take a while.