Fig. 2
Download original image
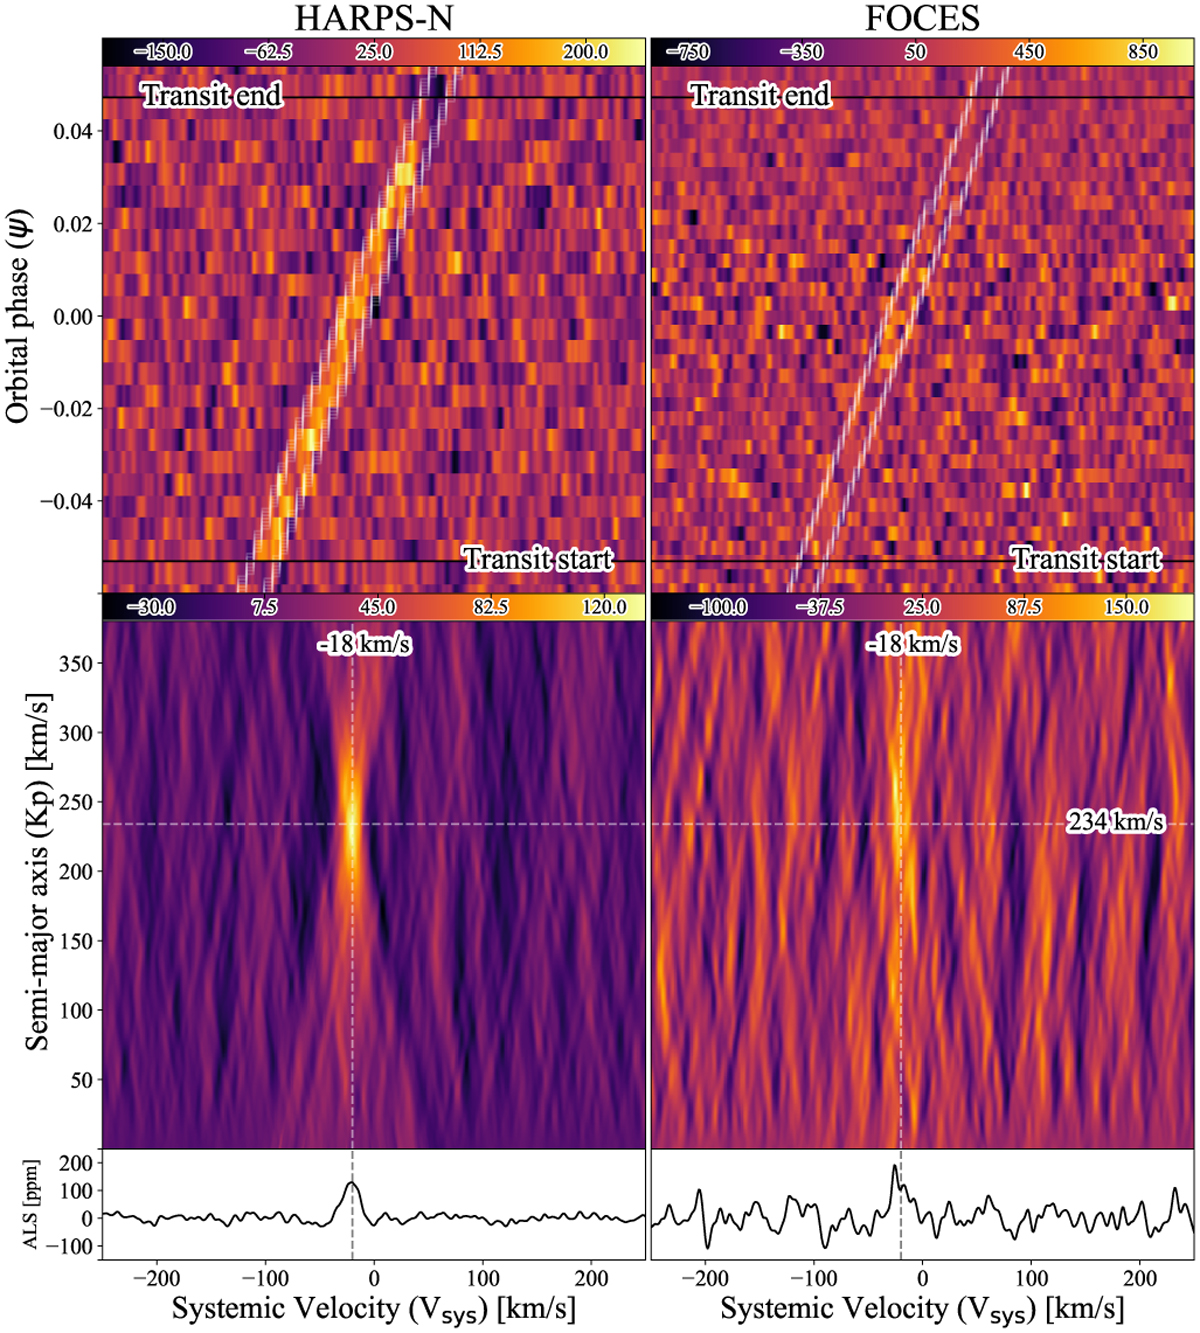
Cross-correlation results for searching for Fe I in a single transit. On the left are the results for the HARPS-N spectrograph on the TNG, and on the right we show the results for the FOCES spectrograph for the night of 18 July 2022. Top panel: cross-correlation maps for FeI. The pixels covering the trace of the planet are outlined to help guide the eye to where to expect the signal. Middle panel: KpVsys maps for each Fe I detection. The detections are the bright features in the centres of the plots. The dashed cross-hairs show the row where the one-dimensional CCF (bottom panel) has been extracted and the expected systemic velocity of KELT-9b (−20 km s−1). Bottom panels: one-dimensional CCFs for the single transits, showing the average line depth for the given signal. The dashed line shows the expected systemic velocity of KELT-9 b, which is the same as in KpVsys map.
Current usage metrics show cumulative count of Article Views (full-text article views including HTML views, PDF and ePub downloads, according to the available data) and Abstracts Views on Vision4Press platform.
Data correspond to usage on the plateform after 2015. The current usage metrics is available 48-96 hours after online publication and is updated daily on week days.
Initial download of the metrics may take a while.