Fig. D.4
Download original image
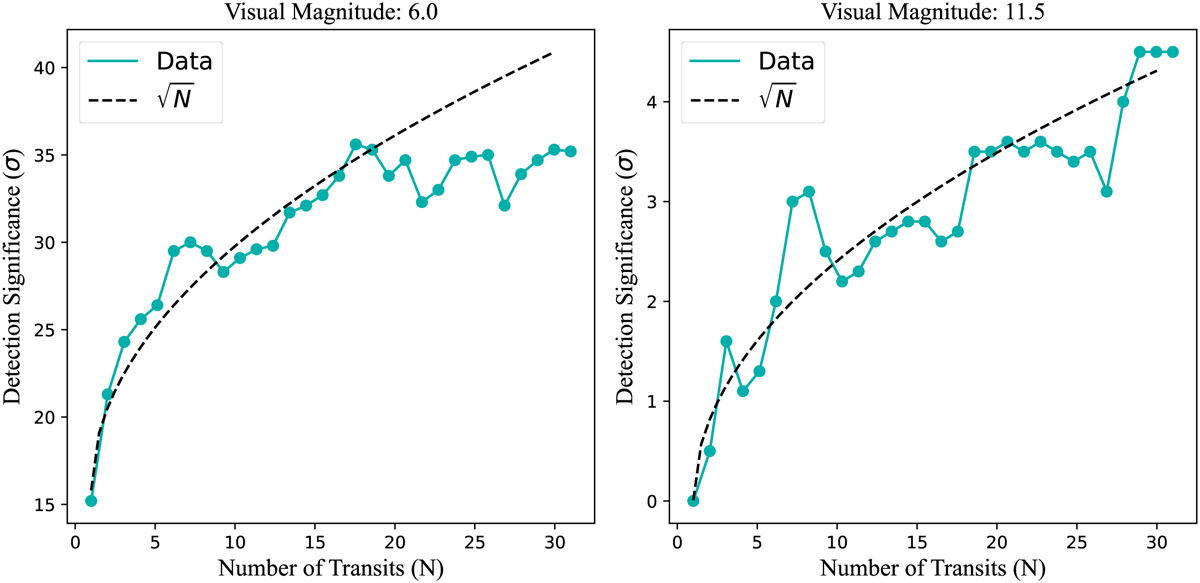
Comparison of the predicted Poisson trend with actual significance in stacked transits, with the transit emulator. Each plot features the number of transits against the detection significance, depicted in teal, alongside a dashed line representing the square root fit of the first ten stacked transits. The left panel illustrates results from stacking transits around a star of magnitude 6.0. The right panel shows a similar trend for a star of magnitude 11.5.
Current usage metrics show cumulative count of Article Views (full-text article views including HTML views, PDF and ePub downloads, according to the available data) and Abstracts Views on Vision4Press platform.
Data correspond to usage on the plateform after 2015. The current usage metrics is available 48-96 hours after online publication and is updated daily on week days.
Initial download of the metrics may take a while.