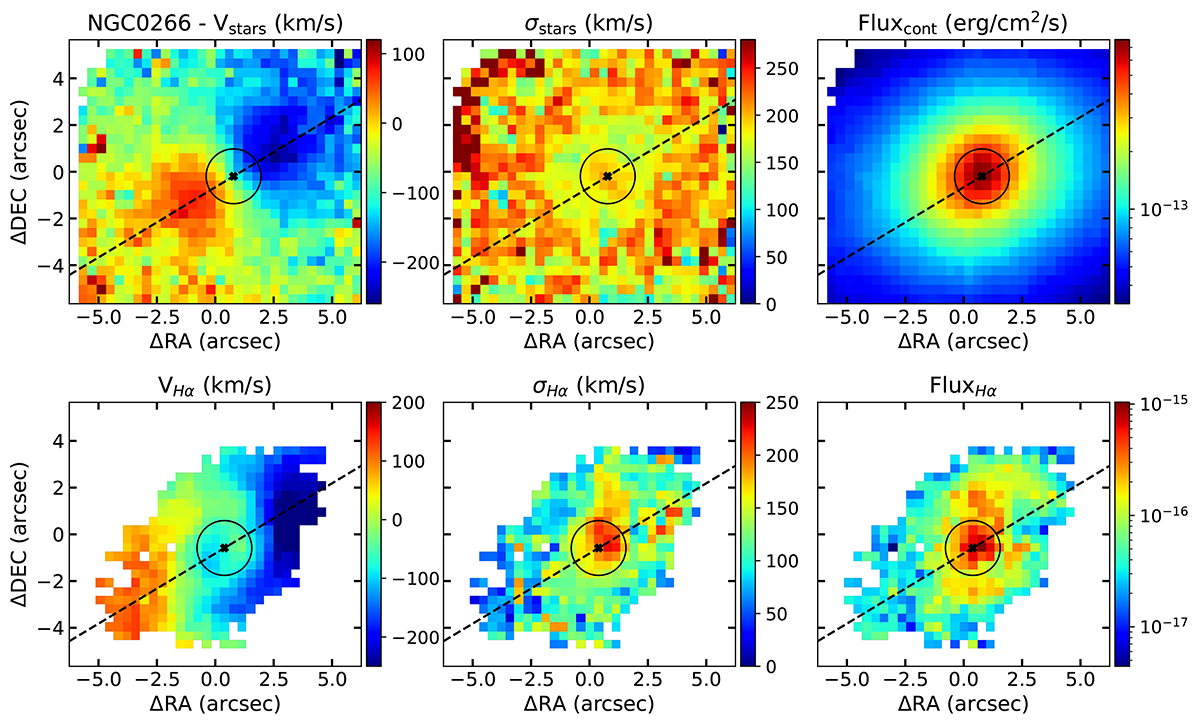
Fig. 4.
Download original image
Kinematic maps for the stellar (top panel) and ionised gas (bottom panel) components of NGC 0266. The stellar kinematics was calculated using the combined LR-VR data cube, whereas the ionised gas kinematics is extracted from the [S II] lines (all the lines share the same kinematics, see Sect. 3.2). In all panels from left to right: velocity in km s−1 (corrected from the systemic velocity of the galaxy; see redshifts in Table 1), velocity dispersion in km s−1 and integrated flux per spaxel (stars) or integrated Hα flux (gas) in erg s−1 cm−2. The black (grey) dashed line, when present, indicates the position angle of the stellar (primary ionised gas) component. The black cross indicates the photometric centre, and the PSF region is marked with a black circle. For all the maps, north is up and east to the left.
Current usage metrics show cumulative count of Article Views (full-text article views including HTML views, PDF and ePub downloads, according to the available data) and Abstracts Views on Vision4Press platform.
Data correspond to usage on the plateform after 2015. The current usage metrics is available 48-96 hours after online publication and is updated daily on week days.
Initial download of the metrics may take a while.