Fig. 3.
Download original image
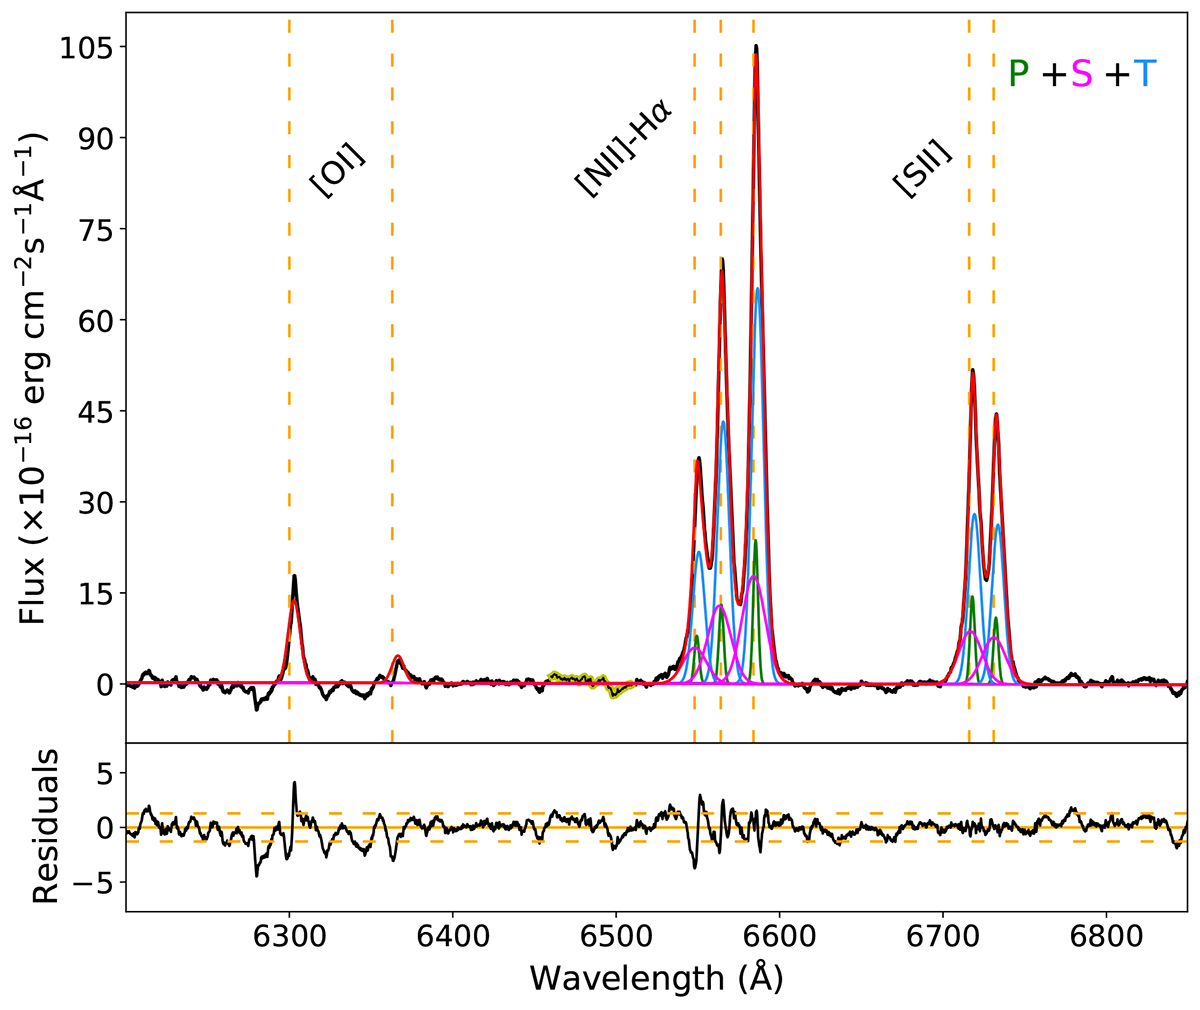
Ionised gas modelling of the integrated LR-R spectrum on the PSF region of NGC 4438. In the top panel the green, pink and blue Gaussians represent the primary (P), secondary (S) and tertiary (T) kinematical components, respectively. The global fit is in red and the region where we estimated the ε from the continuum (εc) is marked in yellow (see Sect. 3.2). In the bottom panel the residuals of the fit are shown in black, with the horizontal, dashed, yellow lines indicating 3εc.
Current usage metrics show cumulative count of Article Views (full-text article views including HTML views, PDF and ePub downloads, according to the available data) and Abstracts Views on Vision4Press platform.
Data correspond to usage on the plateform after 2015. The current usage metrics is available 48-96 hours after online publication and is updated daily on week days.
Initial download of the metrics may take a while.