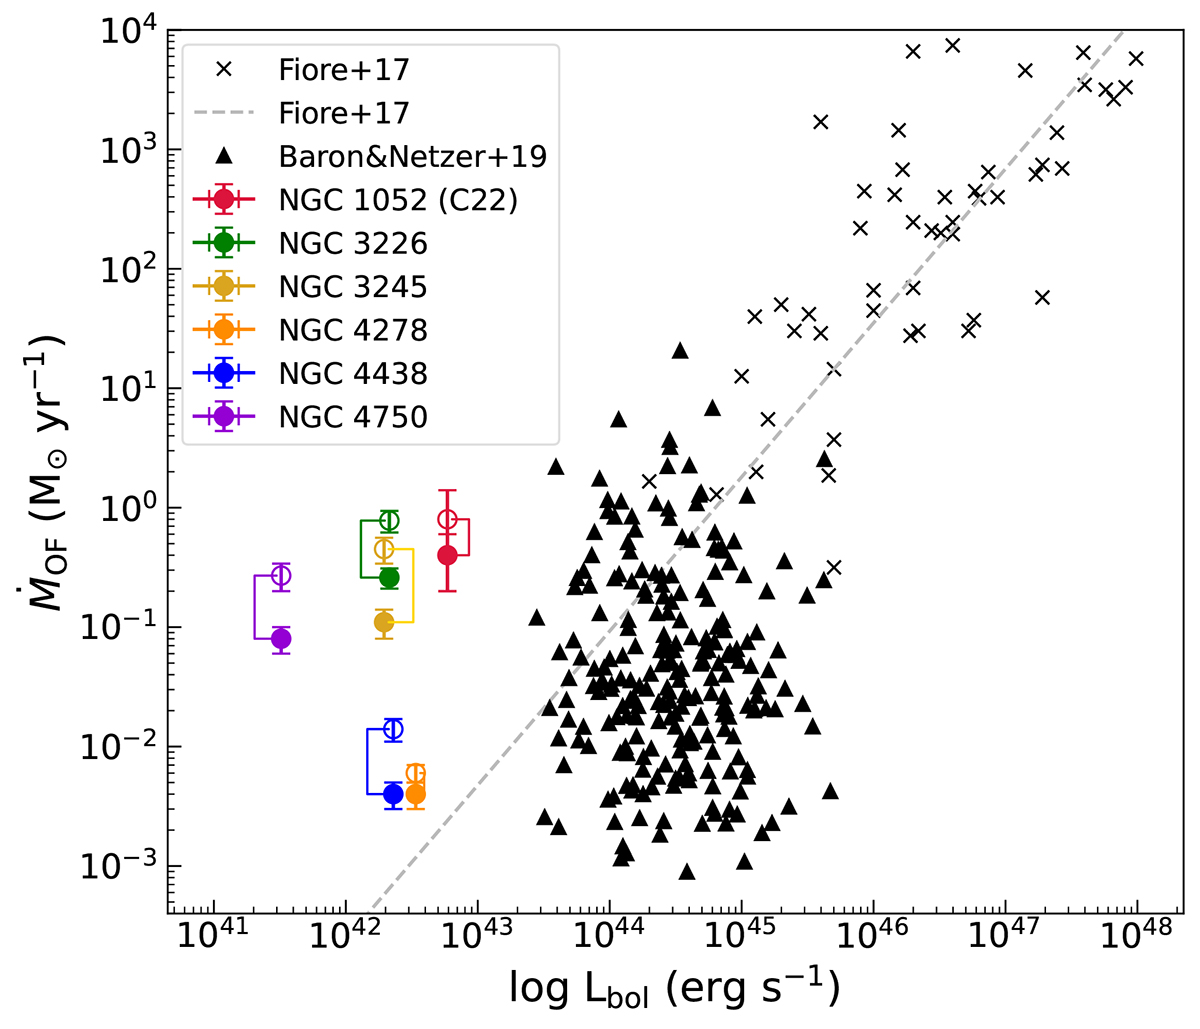
Fig. 15.
Download original image
Mass outflow rate versus bolometric luminosity for ionised gas outflows from different objects. Black crosses represent data obtained from Fiore et al. (2017), and the grey, dashed line is the linear fit they report in their paper; black triangles are the data from Baron & Netzer (2019); the filled circles with their respective errorbars represent the values obtained for the outflows in this work, except NGC 1052 (red circle), estimated in C22. The empty circles are the same objects, but assuming an electron density of 200 cm−3, as Fiore et al. (2017) in their analysis.
Current usage metrics show cumulative count of Article Views (full-text article views including HTML views, PDF and ePub downloads, according to the available data) and Abstracts Views on Vision4Press platform.
Data correspond to usage on the plateform after 2015. The current usage metrics is available 48-96 hours after online publication and is updated daily on week days.
Initial download of the metrics may take a while.