Fig. 14.
Download original image
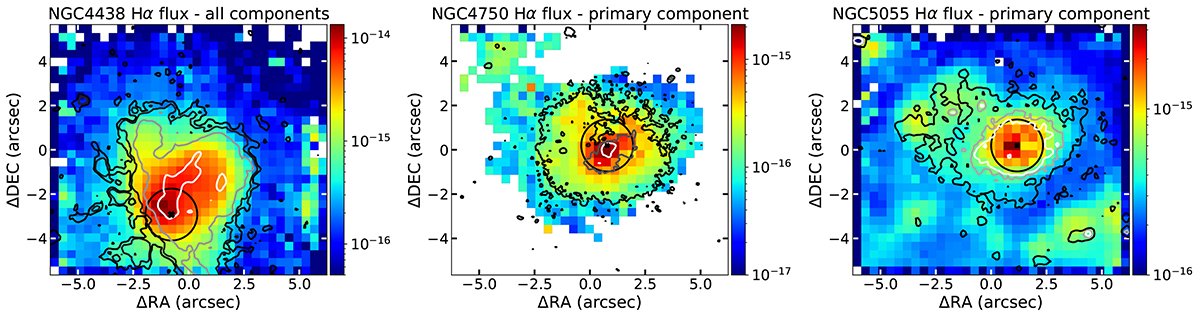
Hα flux derived from the MEGARA data superimposed with the contours of the narrow band HST images of the Hα emission from Masegosa et al. (2011) and HM22 for NGC 4438 (total flux accounting for all components), NGC 4750, and NGC 5055 (only primary component of the emission lines). The inner black circle and the black crosses indicate the PSF region and the photometric centre. The contours for NGC 4750 and NGC 4750 represent the 3σ, 5σ and 10σ (black, grey, and white) flux levels of the narrow band image, with an extra contour at 100σ for NGC 4438 (black, black, grey, white).
Current usage metrics show cumulative count of Article Views (full-text article views including HTML views, PDF and ePub downloads, according to the available data) and Abstracts Views on Vision4Press platform.
Data correspond to usage on the plateform after 2015. The current usage metrics is available 48-96 hours after online publication and is updated daily on week days.
Initial download of the metrics may take a while.