Open Access
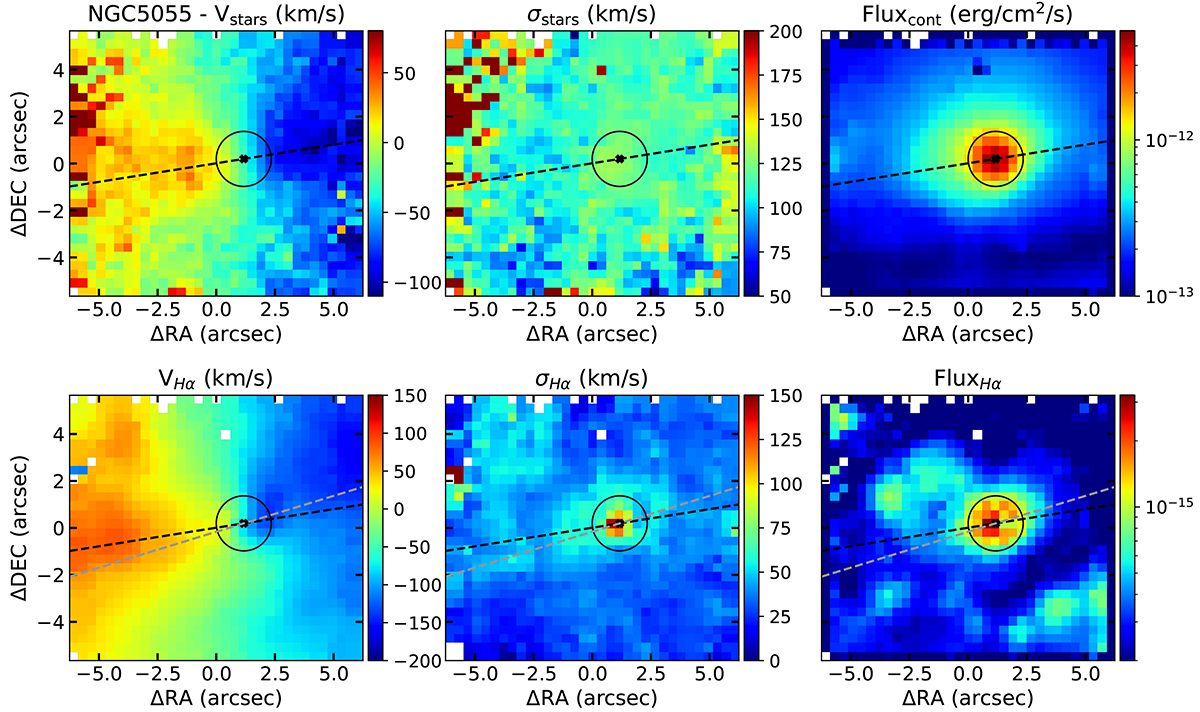
Fig. 11.
Download original image
Kinematic maps for the stellar (top panel) and ionised gas (bottom panel) components of NGC 5055. The spectra of this galaxy was modelled with a single narrow component on the emission lines. A full description is provided in Fig. 4.
Current usage metrics show cumulative count of Article Views (full-text article views including HTML views, PDF and ePub downloads, according to the available data) and Abstracts Views on Vision4Press platform.
Data correspond to usage on the plateform after 2015. The current usage metrics is available 48-96 hours after online publication and is updated daily on week days.
Initial download of the metrics may take a while.