Fig. 7.
Download original image
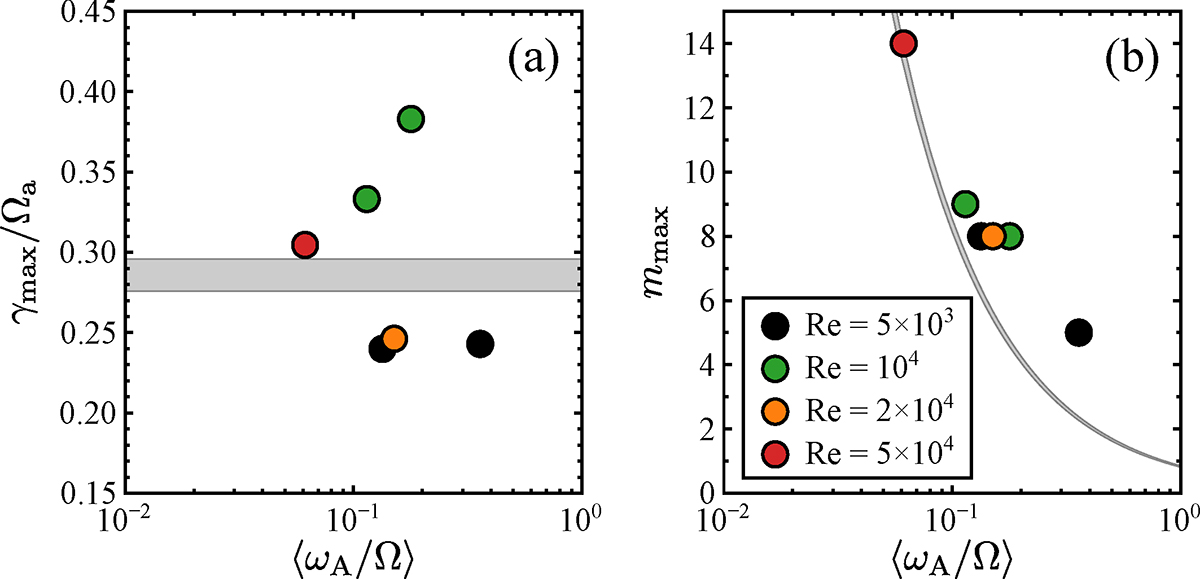
Comparison of the observed most unstable AMRI modes and their growth rates with the local linear theory predictions. (a) Maximum growth rates γmax and (b) most unstable azimuthal modes mmax as a function of ⟨ωA/Ω⟩. The AMRI runs shown are those of Fig. 4 at ![]() , (5 × 10³, 2520), (104, 1125), (104, 2520), (2 × 10⁴, 5012), and (5 × 10⁴, 5012). For each run, γmax and mmax are calculated from the evolution of the toroidal magnetic energy of the linearly unstable modes as explained in the main text. The gray shaded regions display the range of maximum growth rates and most unstable modes predicted by the local linear theory for these runs.
, (5 × 10³, 2520), (104, 1125), (104, 2520), (2 × 10⁴, 5012), and (5 × 10⁴, 5012). For each run, γmax and mmax are calculated from the evolution of the toroidal magnetic energy of the linearly unstable modes as explained in the main text. The gray shaded regions display the range of maximum growth rates and most unstable modes predicted by the local linear theory for these runs.
Current usage metrics show cumulative count of Article Views (full-text article views including HTML views, PDF and ePub downloads, according to the available data) and Abstracts Views on Vision4Press platform.
Data correspond to usage on the plateform after 2015. The current usage metrics is available 48-96 hours after online publication and is updated daily on week days.
Initial download of the metrics may take a while.