Fig. 5.
Download original image
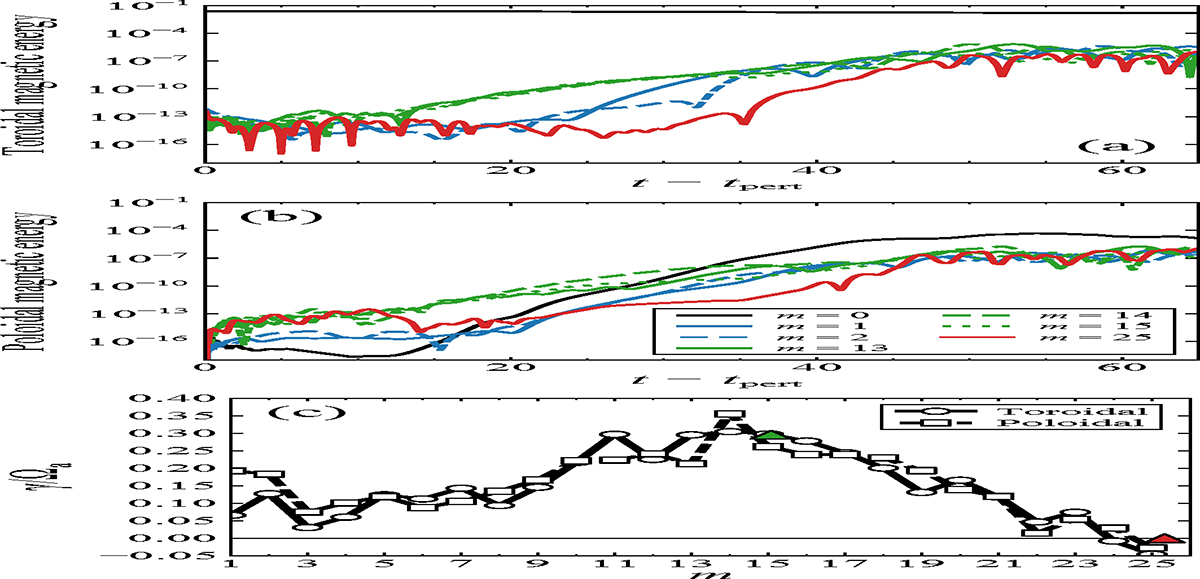
Temporal evolution of various azimuthal modes and observed growth rates for the unstratified run at Re = 5 × 10⁴, ![]() , and Pm = 1. (a) Toroidal and (b) poloidal magnetic energies of various linearly unstable azimuthal modes m as a function of time. The energies are calculated over the spherical surface at radius r/ro = 0.9. The most unstable linear mode is m = 14. The first subcritical mode observed for both energy components is m = 25. (c) Linear growth rates γ/Ωa of the azimuthal modes 1 ≤ m ≤ 25. The growth rates are calculated by fitting the toroidal (solid line) and poloidal (dashed line) magnetic energy evolution shown in (a,b) during the period t − tpert = 9 − 24. The green and red triangles show, respectively, the most unstable and the critical AMRI modes predicted by the local linear theory and evaluated as explained in the main text.
, and Pm = 1. (a) Toroidal and (b) poloidal magnetic energies of various linearly unstable azimuthal modes m as a function of time. The energies are calculated over the spherical surface at radius r/ro = 0.9. The most unstable linear mode is m = 14. The first subcritical mode observed for both energy components is m = 25. (c) Linear growth rates γ/Ωa of the azimuthal modes 1 ≤ m ≤ 25. The growth rates are calculated by fitting the toroidal (solid line) and poloidal (dashed line) magnetic energy evolution shown in (a,b) during the period t − tpert = 9 − 24. The green and red triangles show, respectively, the most unstable and the critical AMRI modes predicted by the local linear theory and evaluated as explained in the main text.
Current usage metrics show cumulative count of Article Views (full-text article views including HTML views, PDF and ePub downloads, according to the available data) and Abstracts Views on Vision4Press platform.
Data correspond to usage on the plateform after 2015. The current usage metrics is available 48-96 hours after online publication and is updated daily on week days.
Initial download of the metrics may take a while.