Fig. 4.
Download original image
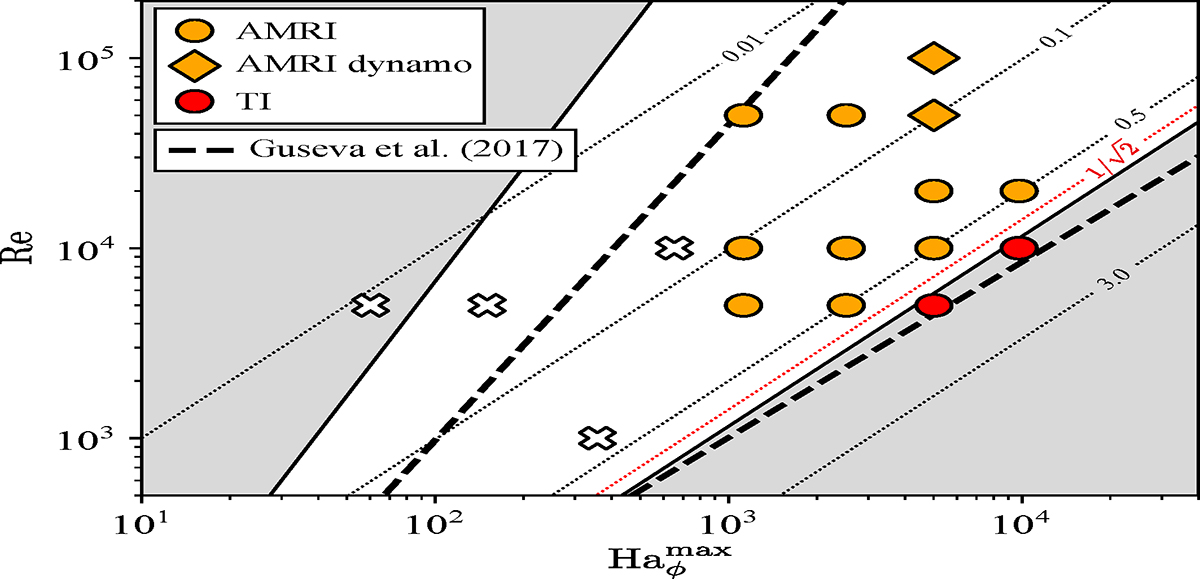
Instability domain of the unstratified (𝒩 = 0) axisymmetric solutions at Pm = 1 and comparison with local and global linear stability analysis results. The Reynolds number Re is shown as a function of ![]() , the maximum azimuthal Hartmann number in the fluid domain at the perturbation time tpert. Crosses denote stable runs, that is simulations where the applied nonaxisymmetric perturbations decay. Orange (red) symbols display runs where AMRI (TI) is identified. Circles (squares) denote transient (self-sustained) turbulence for the nonlinear instability evolution. The white area shows the region unstable to AMRI according to order of magnitude estimates based on a local linear analysis (Eq. (20)). AMRI is stabilized by diffusive effects at lower magnetic field strengths (gray area on the left) and by magnetic tension at larger field strengths (gray area on the right). The thin dotted lines are isocontours of the azimuthal Lehnert number
, the maximum azimuthal Hartmann number in the fluid domain at the perturbation time tpert. Crosses denote stable runs, that is simulations where the applied nonaxisymmetric perturbations decay. Orange (red) symbols display runs where AMRI (TI) is identified. Circles (squares) denote transient (self-sustained) turbulence for the nonlinear instability evolution. The white area shows the region unstable to AMRI according to order of magnitude estimates based on a local linear analysis (Eq. (20)). AMRI is stabilized by diffusive effects at lower magnetic field strengths (gray area on the left) and by magnetic tension at larger field strengths (gray area on the right). The thin dotted lines are isocontours of the azimuthal Lehnert number ![]() . For
. For ![]() up to
up to ![]() (red dotted line) the expected maximum growth rate of AMRI is larger than the one of TI (Eq. (24)). The thick dashed lines are reproduced from Fig. 1a of Guseva et al. (2017b) and show the lower and upper neutral stability lines of AMRI from their global linear analysis of Taylor–Couette flow for a quasi-Keplerian shear.
(red dotted line) the expected maximum growth rate of AMRI is larger than the one of TI (Eq. (24)). The thick dashed lines are reproduced from Fig. 1a of Guseva et al. (2017b) and show the lower and upper neutral stability lines of AMRI from their global linear analysis of Taylor–Couette flow for a quasi-Keplerian shear.
Current usage metrics show cumulative count of Article Views (full-text article views including HTML views, PDF and ePub downloads, according to the available data) and Abstracts Views on Vision4Press platform.
Data correspond to usage on the plateform after 2015. The current usage metrics is available 48-96 hours after online publication and is updated daily on week days.
Initial download of the metrics may take a while.