Fig. A.2.
Download original image
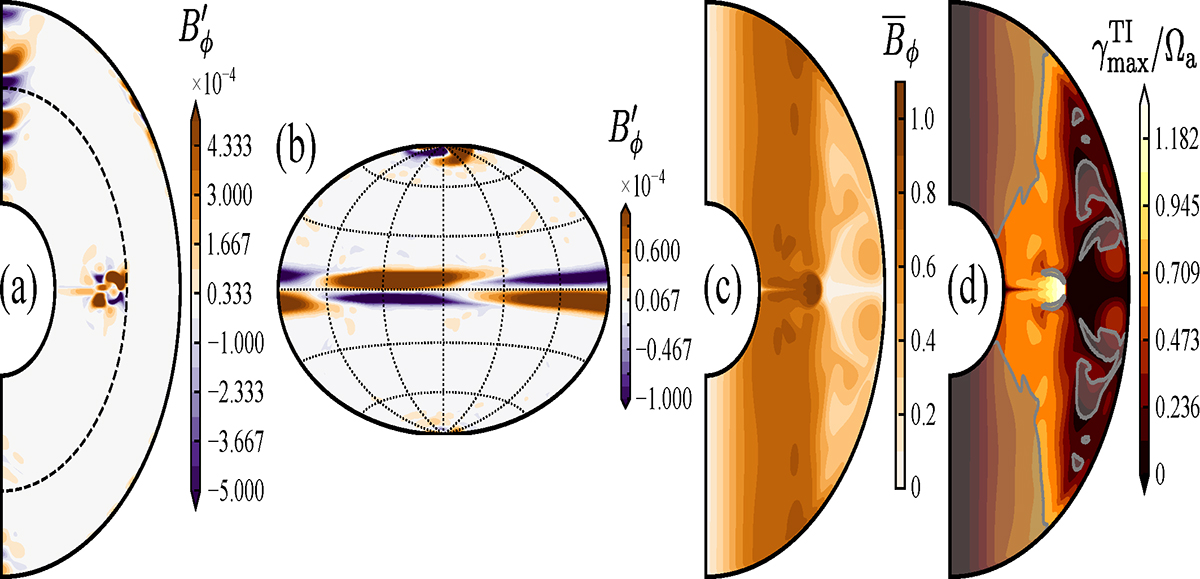
Tayler instability in run U4 and comparison with local linear analysis predictions. (a) Meridional cut and (b) surface projection of the nonaxisymmetric azimuthal field ![]() at time t − tpert = 3.5 during the linear phase of the instability growth. The surface projection is taken at radius r/ro = 0.7, which is indicated by the dashed line in (a). (c) Axisymmetric azimuthal field
at time t − tpert = 3.5 during the linear phase of the instability growth. The surface projection is taken at radius r/ro = 0.7, which is indicated by the dashed line in (a). (c) Axisymmetric azimuthal field ![]() at the perturbation time tpert = 33.2. (d) Theoretical TI growth rate
at the perturbation time tpert = 33.2. (d) Theoretical TI growth rate ![]() . The gray shaded areas show the locations where the instability condition (A.1) for the m = 1 mode and the axisymmetric azimuthal field solution in (c) is fulfilled.
. The gray shaded areas show the locations where the instability condition (A.1) for the m = 1 mode and the axisymmetric azimuthal field solution in (c) is fulfilled.
Current usage metrics show cumulative count of Article Views (full-text article views including HTML views, PDF and ePub downloads, according to the available data) and Abstracts Views on Vision4Press platform.
Data correspond to usage on the plateform after 2015. The current usage metrics is available 48-96 hours after online publication and is updated daily on week days.
Initial download of the metrics may take a while.