Fig. 20.
Download original image
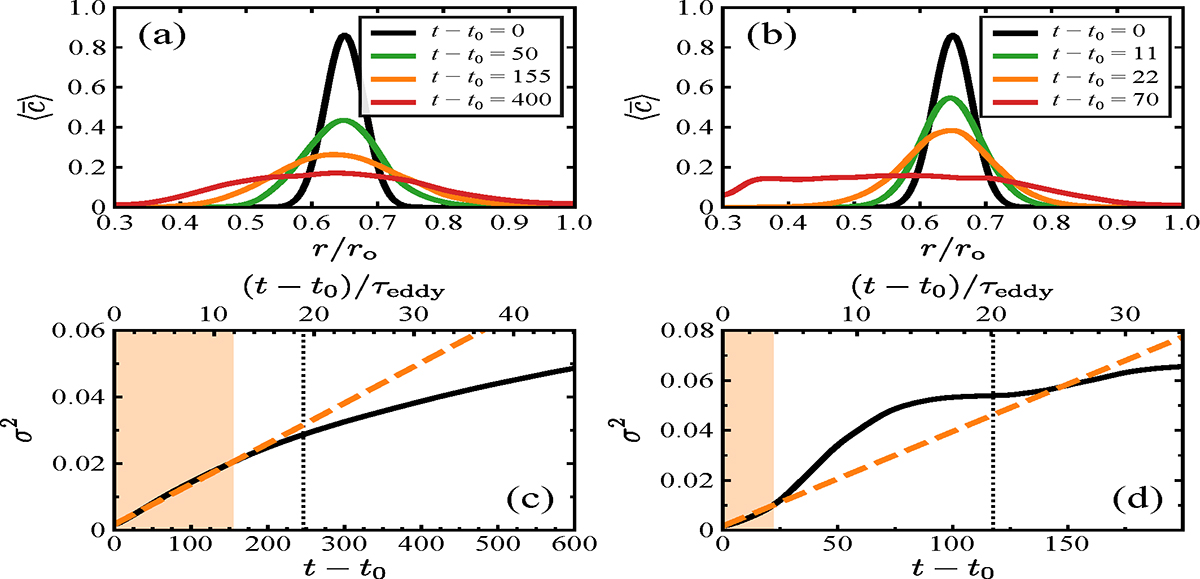
Chemical turbulent transport for run C5 at 𝒩 = 10 and Pr = 10−3 (left panels) and for the unstratified run C0 (right panels). (a,b) Radial distribution of the horizontally averaged mean chemical concentration ![]() at the times t − t0 indicated in the legend. The first three times cover the diffusive phase of the transport. (c,d) Variance σ2 of the mean chemical concentration
at the times t − t0 indicated in the legend. The first three times cover the diffusive phase of the transport. (c,d) Variance σ2 of the mean chemical concentration ![]() as a function of t − t0. The dashed line is defined by the time average of dσ2/dt evaluated over the diffusive phase of the transport (orange shaded background). The vertical dotted line marks the time t − t0 = τM/τΩ after which the meridional flow is expected to dominate the transport. Here τM is the meridional flow timescale estimated as explained in the main text. The upper horizontal axis displays time scaled in units of the eddy turnover time τeddy.
as a function of t − t0. The dashed line is defined by the time average of dσ2/dt evaluated over the diffusive phase of the transport (orange shaded background). The vertical dotted line marks the time t − t0 = τM/τΩ after which the meridional flow is expected to dominate the transport. Here τM is the meridional flow timescale estimated as explained in the main text. The upper horizontal axis displays time scaled in units of the eddy turnover time τeddy.
Current usage metrics show cumulative count of Article Views (full-text article views including HTML views, PDF and ePub downloads, according to the available data) and Abstracts Views on Vision4Press platform.
Data correspond to usage on the plateform after 2015. The current usage metrics is available 48-96 hours after online publication and is updated daily on week days.
Initial download of the metrics may take a while.