Fig. 18.
Download original image
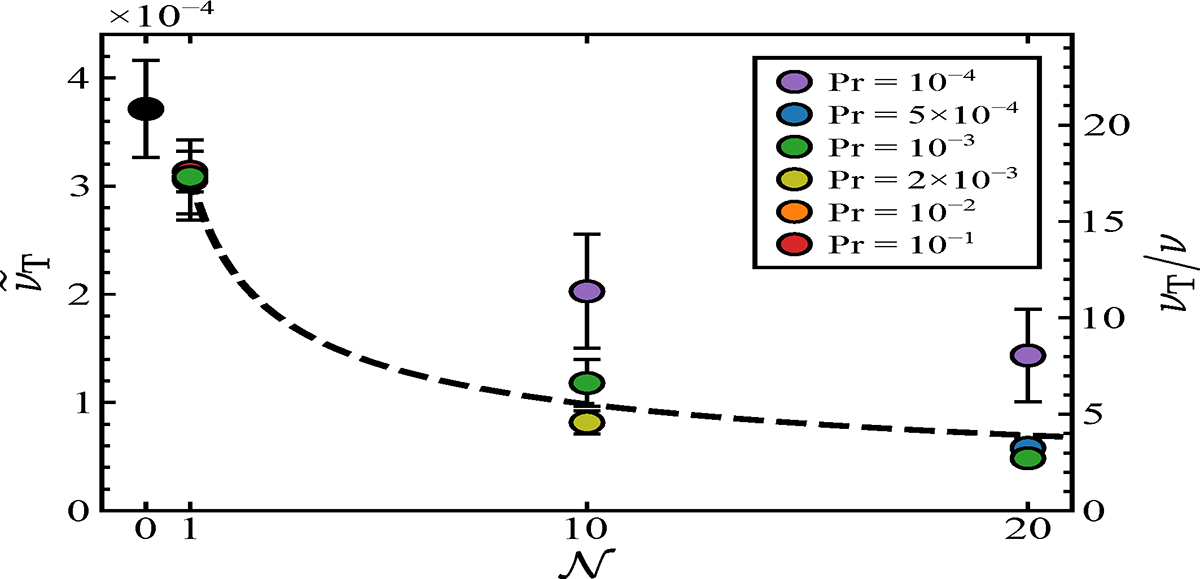
Turbulent viscosity ![]() as a function of 𝒩 for Re = 5 × 10⁴ and Pm = 1. The symbol color shows the Prandtl number Pr as indicated in the legend. The black circle at 𝒩 = 0 is the fiducial dynamo run U0. The error bars show 1 standard deviation intervals around the time averages, which are evaluated over the periods Δt listed in Table 1. The dashed curve shows a power law fit
as a function of 𝒩 for Re = 5 × 10⁴ and Pm = 1. The symbol color shows the Prandtl number Pr as indicated in the legend. The black circle at 𝒩 = 0 is the fiducial dynamo run U0. The error bars show 1 standard deviation intervals around the time averages, which are evaluated over the periods Δt listed in Table 1. The dashed curve shows a power law fit ![]() of the stratified runs at Pr = 10−3. The best fitting parameters are a = 3.1 × 10⁻⁴ and δ = 0.50. The right vertical axis displays the turbulent viscosity in units of the molecular viscosity ν.
of the stratified runs at Pr = 10−3. The best fitting parameters are a = 3.1 × 10⁻⁴ and δ = 0.50. The right vertical axis displays the turbulent viscosity in units of the molecular viscosity ν.
Current usage metrics show cumulative count of Article Views (full-text article views including HTML views, PDF and ePub downloads, according to the available data) and Abstracts Views on Vision4Press platform.
Data correspond to usage on the plateform after 2015. The current usage metrics is available 48-96 hours after online publication and is updated daily on week days.
Initial download of the metrics may take a while.