Open Access
Fig. 15.
Download original image
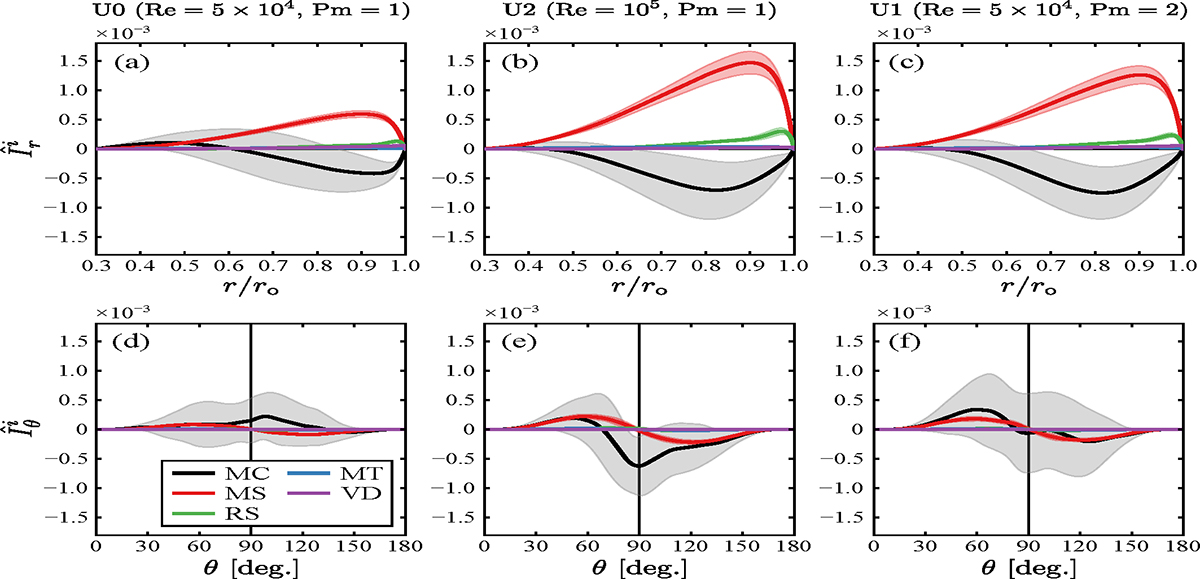
Time averaged integrated fluxes (a–c) ![]() and (d–f)
and (d–f) ![]() for the unstratified runs U0, U2, and U1 (from left to right). The shaded area around each flux contribution shows 1 standard deviation above and below the time average. The scale of the vertical axis is the same in all panels.
for the unstratified runs U0, U2, and U1 (from left to right). The shaded area around each flux contribution shows 1 standard deviation above and below the time average. The scale of the vertical axis is the same in all panels.
Current usage metrics show cumulative count of Article Views (full-text article views including HTML views, PDF and ePub downloads, according to the available data) and Abstracts Views on Vision4Press platform.
Data correspond to usage on the plateform after 2015. The current usage metrics is available 48-96 hours after online publication and is updated daily on week days.
Initial download of the metrics may take a while.