Fig. 8.
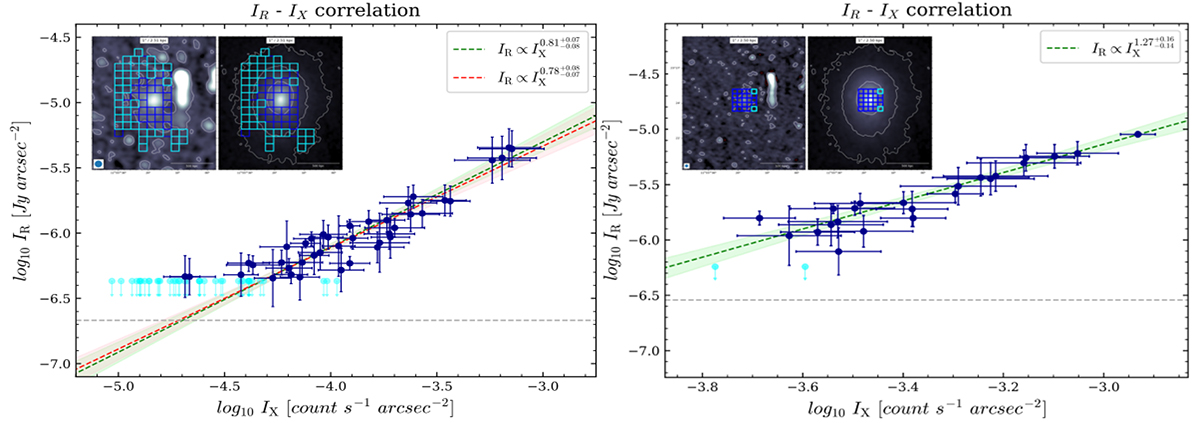
Download original image
Spatial correlation between X-ray and radio surface brightness. Left panel: IR − IX relation of the halo in A1413, extracted in square boxes with width of 35″. The horizontal gray dash-dotted lines indicate the σrms = 298 μJy beam−1 in the radio maps. Right panel: IR − IX relation of the mini halo in A1413, extracted in square boxes with a width of 23″. The horizontal gray dash-dotted lines indicate the σrms = 203 μJy beam−1 in the radio maps. For both relations, upper limits (cyan points) refer to cells where the radio surface brightness is below the 2σrms level. The best-fit (green dashed line) is reported with the corresponding 1σ confidence interval. Red dashed best-fit line (left panel) refers to the correlation without the four central boxes.
Current usage metrics show cumulative count of Article Views (full-text article views including HTML views, PDF and ePub downloads, according to the available data) and Abstracts Views on Vision4Press platform.
Data correspond to usage on the plateform after 2015. The current usage metrics is available 48-96 hours after online publication and is updated daily on week days.
Initial download of the metrics may take a while.