Fig. 5.
Download original image
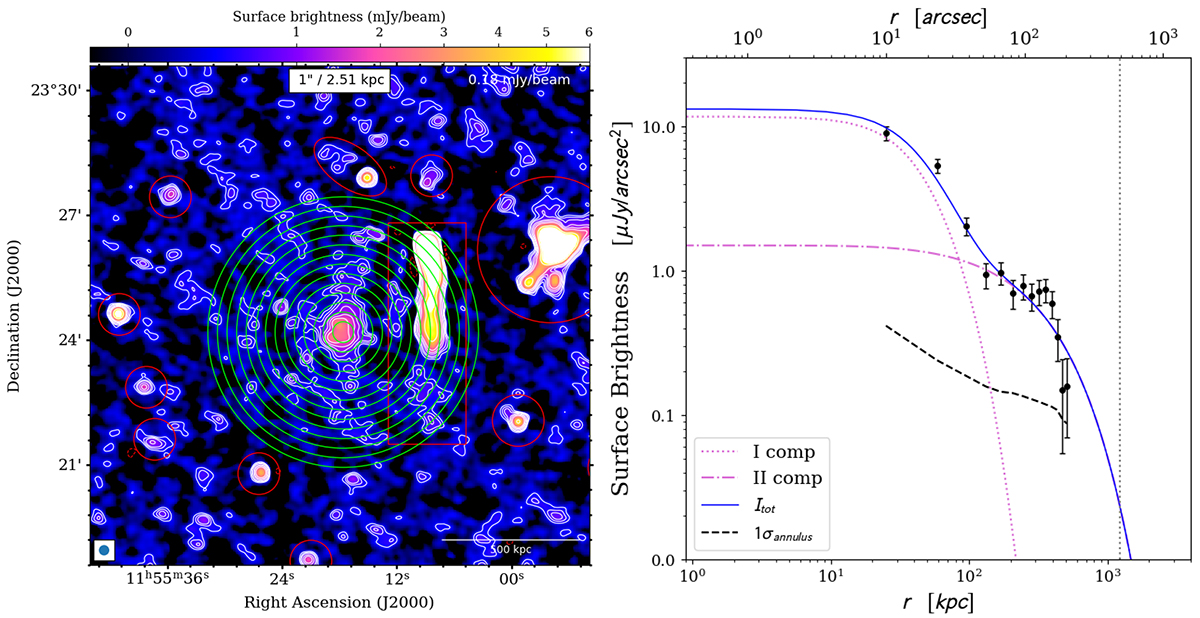
1D radio surface-brightness profile. Left panel: medium resolution (15″ × 15″) source-subtracted image at 144 MHz. Masked regions are shown in red, together with the green annuli where the surface brightness has been extracted. The contour levels start at 2σrms, where σrms = 0.18 mJy beam−1, and are spaced with a factor of ![]() . The −3σrms contours are red. Right panel: radio surface-brightness profile. The solid line represents the resulting double exponential model, while the single components are plotted as a reference. The central mini-halo component has re, 1 = 28 ± 5 kpc, while the second broader component has re, 2 = 290 ± 60 kpc. The vertical line indicates R500, and the dashed black line indicates the 1σannulus detection limit for each annulus.
. The −3σrms contours are red. Right panel: radio surface-brightness profile. The solid line represents the resulting double exponential model, while the single components are plotted as a reference. The central mini-halo component has re, 1 = 28 ± 5 kpc, while the second broader component has re, 2 = 290 ± 60 kpc. The vertical line indicates R500, and the dashed black line indicates the 1σannulus detection limit for each annulus.
Current usage metrics show cumulative count of Article Views (full-text article views including HTML views, PDF and ePub downloads, according to the available data) and Abstracts Views on Vision4Press platform.
Data correspond to usage on the plateform after 2015. The current usage metrics is available 48-96 hours after online publication and is updated daily on week days.
Initial download of the metrics may take a while.