Open Access
Fig. 4.
Download original image
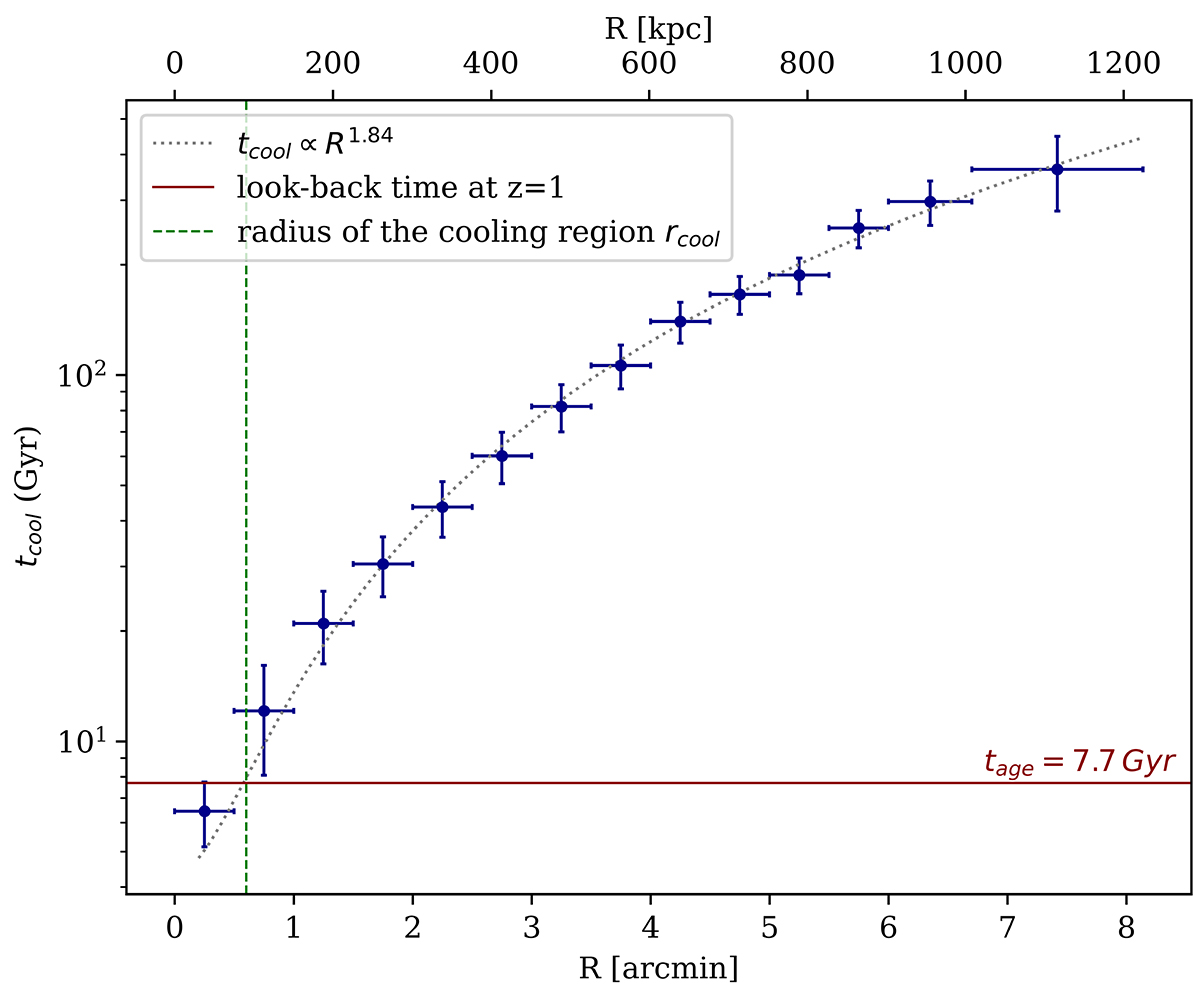
Cooling time profile for A1413. The red solid line represents the look-back time at z = 1, tage = 7.7 Gyr. The power-law fit with tcool = 9.27R1.84 allows us to define the cooling radius (green vertical line), namely the region within which tcool < tage.
Current usage metrics show cumulative count of Article Views (full-text article views including HTML views, PDF and ePub downloads, according to the available data) and Abstracts Views on Vision4Press platform.
Data correspond to usage on the plateform after 2015. The current usage metrics is available 48-96 hours after online publication and is updated daily on week days.
Initial download of the metrics may take a while.