Open Access
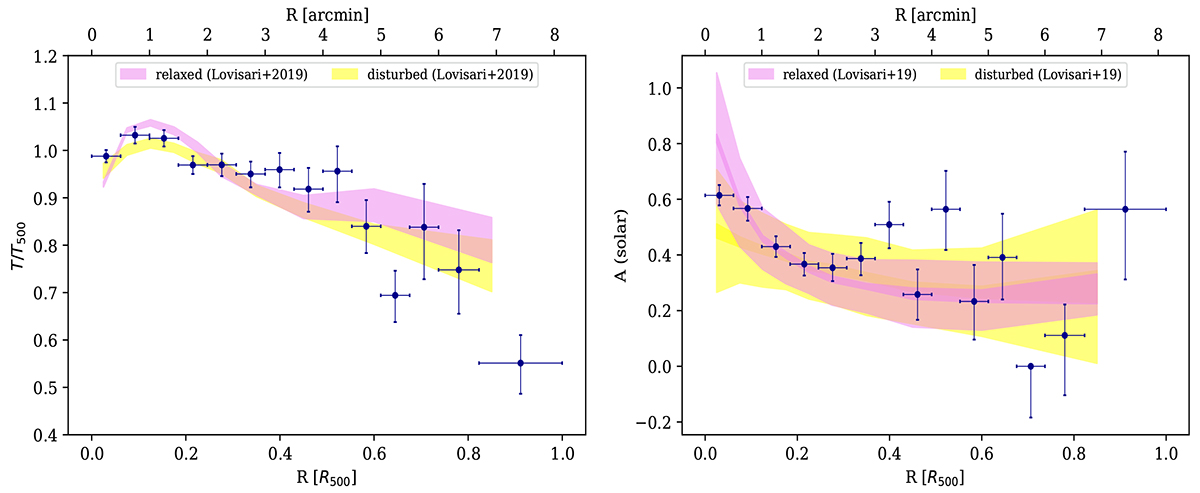
Fig. 2.
Download original image
1D thermodynamical profiles obtained from spectral fitting, up to R500. Left panel: projected temperature profile. Right panel: metal abundance profile. Both profiles are compared with different averaged values of relaxed system samples (pink) and disturbed ones (yellow) from Lovisari & Reiprich (2019).
Current usage metrics show cumulative count of Article Views (full-text article views including HTML views, PDF and ePub downloads, according to the available data) and Abstracts Views on Vision4Press platform.
Data correspond to usage on the plateform after 2015. The current usage metrics is available 48-96 hours after online publication and is updated daily on week days.
Initial download of the metrics may take a while.