Fig. 1.
Download original image
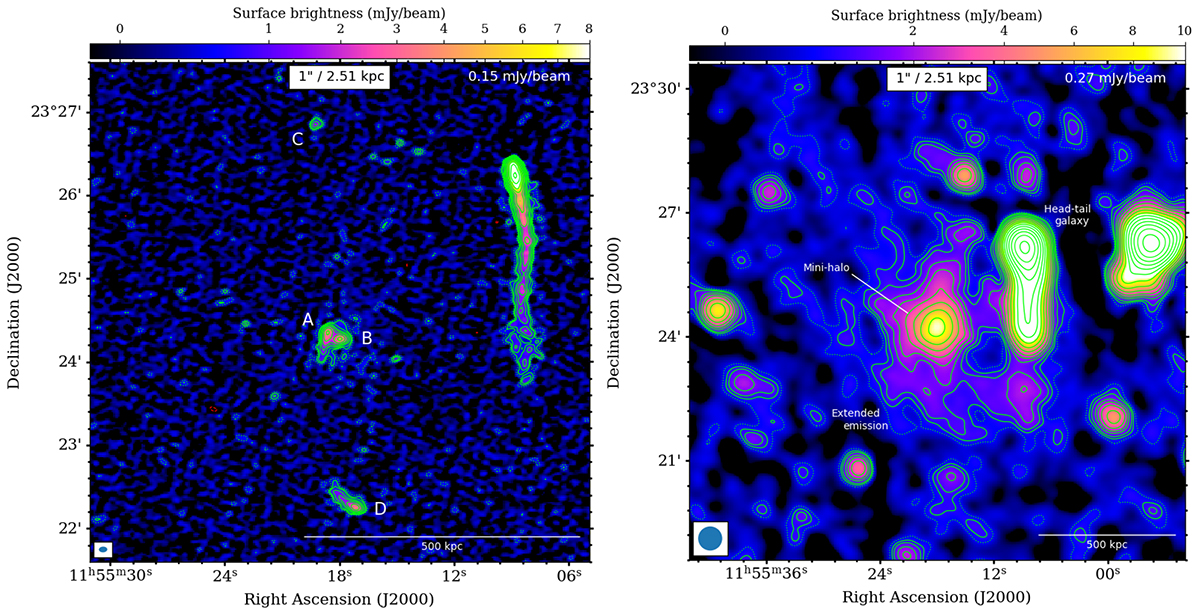
High- and low-resolution radio images of A1413 at 144 MHz. Left panel: high resolution 144 MHz image with 4″ × 6″ beam (shown in the bottom left corner) and noise σrms = 0.15 mJy beam−1. Sources that have been subtracted are labelled with letters: two central AGNs A, B; one point-like north source C and one extended south source D. Right panel: low-resolution source-subtracted 144 MHz image with 35″ × 35″ beam (shown in the bottom left corner) and noise σrms = 0.27 mJy beam−1. For both images, the contour levels start at 2σrms and are spaced with a factor of ![]() . The −3σrms contours are red, while 2σrms contours are dotted green.
. The −3σrms contours are red, while 2σrms contours are dotted green.
Current usage metrics show cumulative count of Article Views (full-text article views including HTML views, PDF and ePub downloads, according to the available data) and Abstracts Views on Vision4Press platform.
Data correspond to usage on the plateform after 2015. The current usage metrics is available 48-96 hours after online publication and is updated daily on week days.
Initial download of the metrics may take a while.