Fig. 9
Download original image
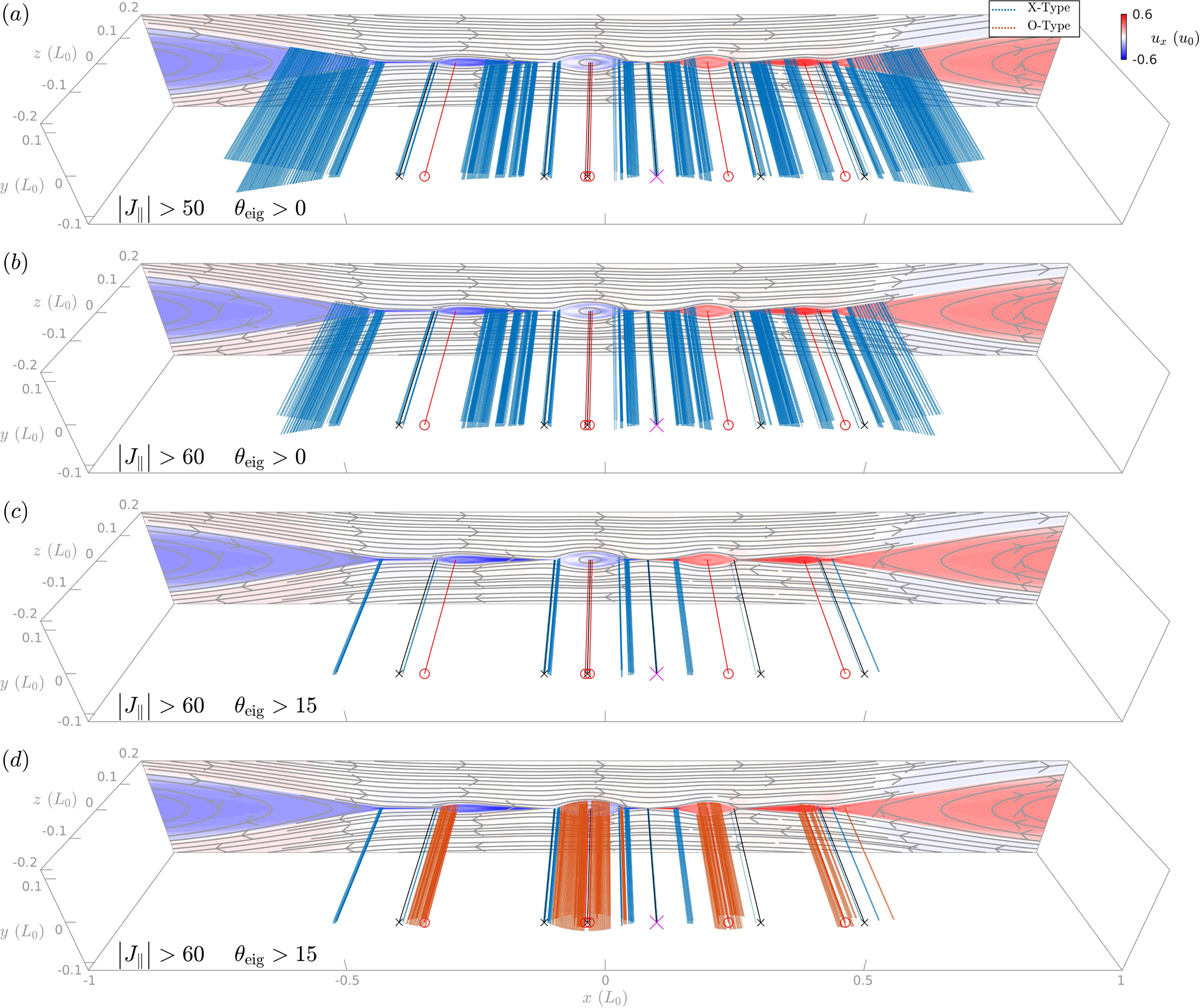
Distributions of 3D X and O-type grids within a 2.5D Harris-sheet reconnection. The 3D magnetic field has z-symmetry and is constructed from a 2.5D simulation with the same configurations as the 3D Harris sheet in Sect. 5. This figure shows the result at t = 4. In panel a, the blue dots have the same definition as in Figs. 3 and 4. The black “x” and red “o” markers depict the positions of 2D X and O points on the x–y plane as determine d by the 2D method, while the black and red lines are the corresponding X and O lines in 3D. The principal reconnection site with strongest |J‖| is marked by a magenta “x” marker. On the plane z = 0.2, the profile of ux is depicted while the magnetic field lines are shown by gray curves. Panels b and c are similar to panel a but exhibit results with different thresholds of |J‖| and θeig. Panel d has the same thresholds as c but also plots 3D O-type grids with orange dots.
Current usage metrics show cumulative count of Article Views (full-text article views including HTML views, PDF and ePub downloads, according to the available data) and Abstracts Views on Vision4Press platform.
Data correspond to usage on the plateform after 2015. The current usage metrics is available 48-96 hours after online publication and is updated daily on week days.
Initial download of the metrics may take a while.