Fig. 8
Download original image
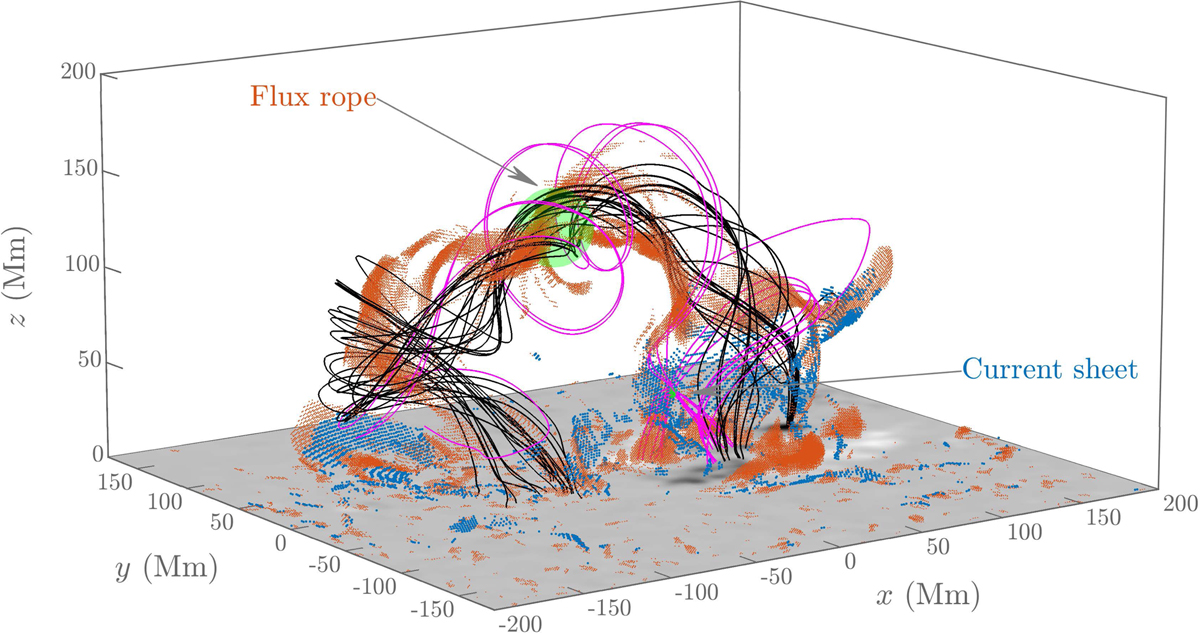
Distributions of 3D X-type (blue dots) and O-type (orange dots) grids in a data-driven simulation of a large-scale coronal flux rope eruption. The plotted grids are 2D projected extreme points of J‖, satisfying |J‖| > 11.9 statC s−1 cm−2. The black curves are field lines traced from the initial sampling positions near the top of the flux rope as marked by the big green sphere, while the magenta ones are traced from a small region in the eruption current sheet as marked by the small green sphere. The distribution of Bz is overlapped at the bottom.
Current usage metrics show cumulative count of Article Views (full-text article views including HTML views, PDF and ePub downloads, according to the available data) and Abstracts Views on Vision4Press platform.
Data correspond to usage on the plateform after 2015. The current usage metrics is available 48-96 hours after online publication and is updated daily on week days.
Initial download of the metrics may take a while.