Fig. 3
Download original image
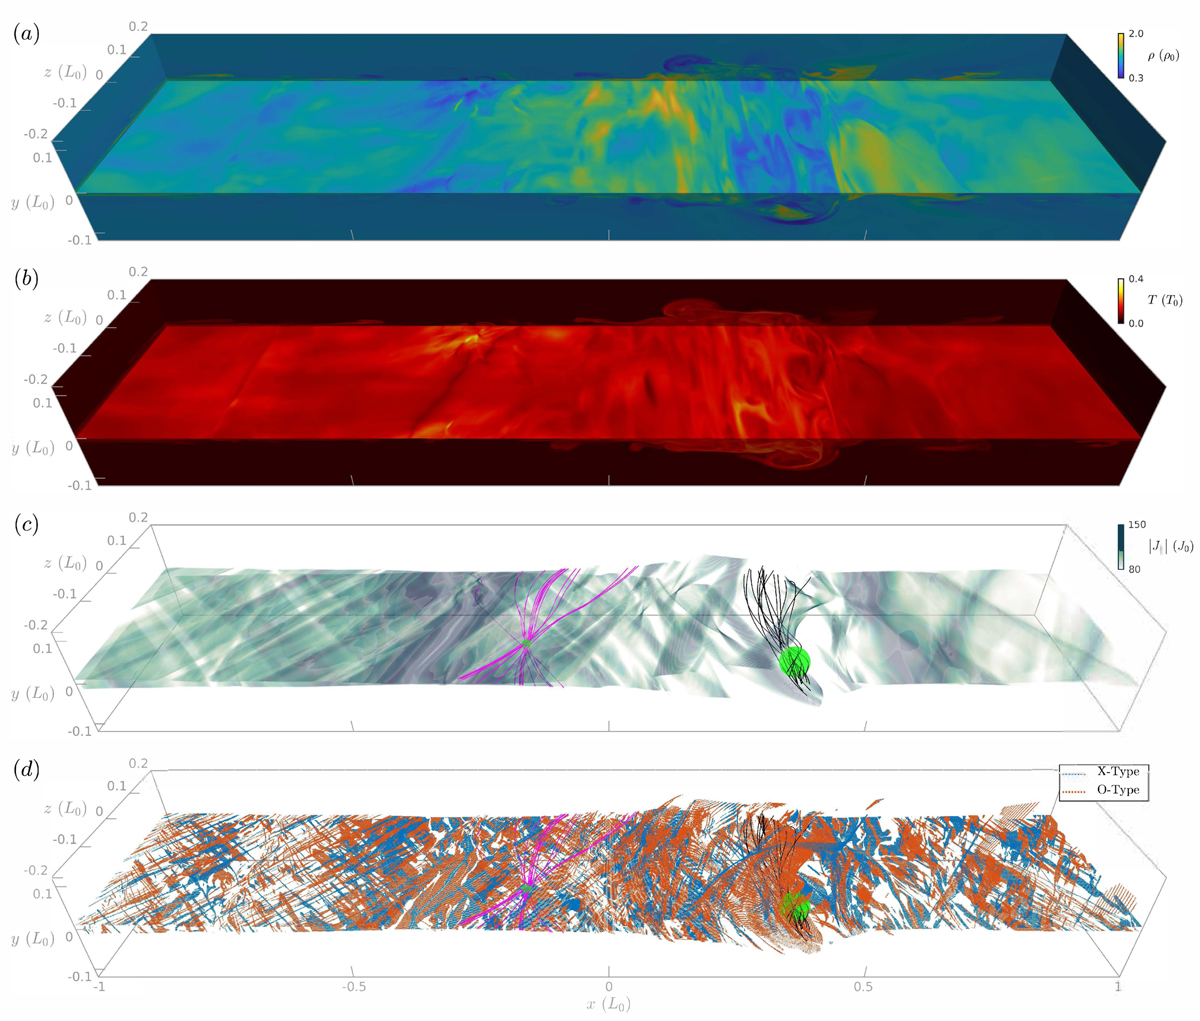
Distributions of mass density p a, temperature T b, parallel current density |J‖| c, and 3D X and O-type grids d at t = 9. For p and T, we only depict their distributions on the current-sheet middle plane (y = 0), the front and back planes (z = ±0.2), and the left and right planes (x = ±1). Panel c shows the 3D profile of |J‖| satisfying |J‖| > 80. In panel d, we plot the grids that (1) satisfy |J‖| > 50, (2) have local magnetic structures of 3D X and O types, and (3) are 2D projected extreme points of J‖. The X-type (type 1) grids are depicted by blue dots, while the O-type grids (types 2 and 3) are plotted by orange ones. The magenta and black curves in panels c and d are examples of sheared and twisted field lines, which are traced from the initial sampling positions near 3D X-type and O-type grids, respectively. The green spheres mark the regions for sampling start positions of field-line tracing. An animation of this figure showing the entire evolution from t = 0–9 is available.
Current usage metrics show cumulative count of Article Views (full-text article views including HTML views, PDF and ePub downloads, according to the available data) and Abstracts Views on Vision4Press platform.
Data correspond to usage on the plateform after 2015. The current usage metrics is available 48-96 hours after online publication and is updated daily on week days.
Initial download of the metrics may take a while.