Fig. 2
Download original image
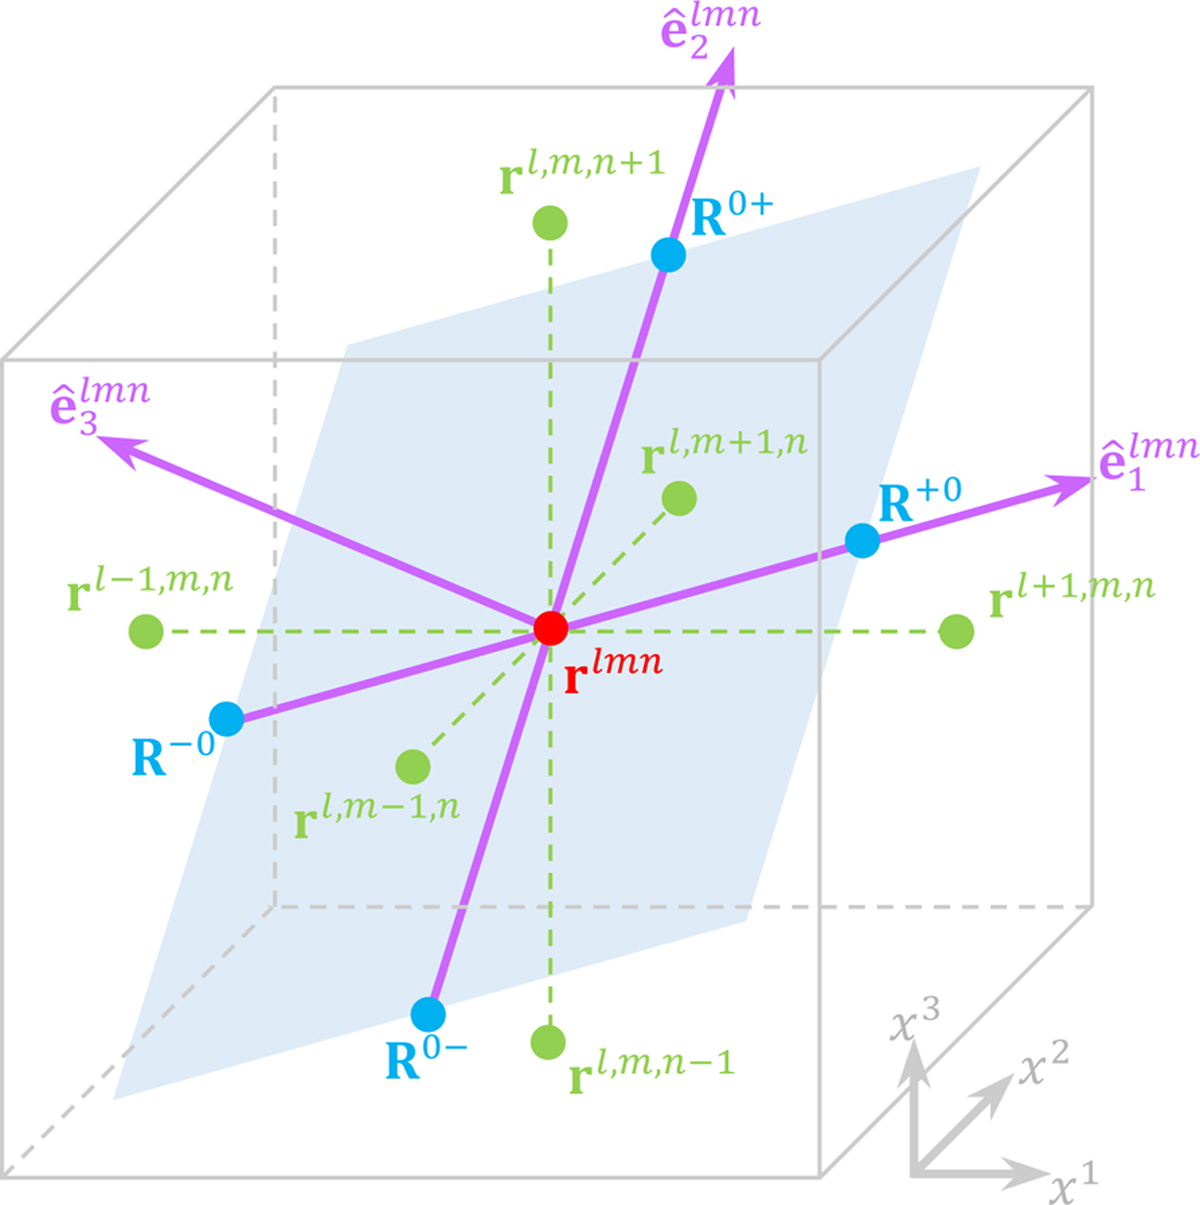
Schematic diagram of the local frame at a grid rlmn. The purple arrow lines span the local frame. The light blue shade presents the MPP. The blue dots depict four adjacent grids on the MPP that are one step-length (ΔL) away from the origin point. The green dots are six adjacent grids surrounding rlmn in the frame of original discrete data.
Current usage metrics show cumulative count of Article Views (full-text article views including HTML views, PDF and ePub downloads, according to the available data) and Abstracts Views on Vision4Press platform.
Data correspond to usage on the plateform after 2015. The current usage metrics is available 48-96 hours after online publication and is updated daily on week days.
Initial download of the metrics may take a while.