Fig. B.1
Download original image
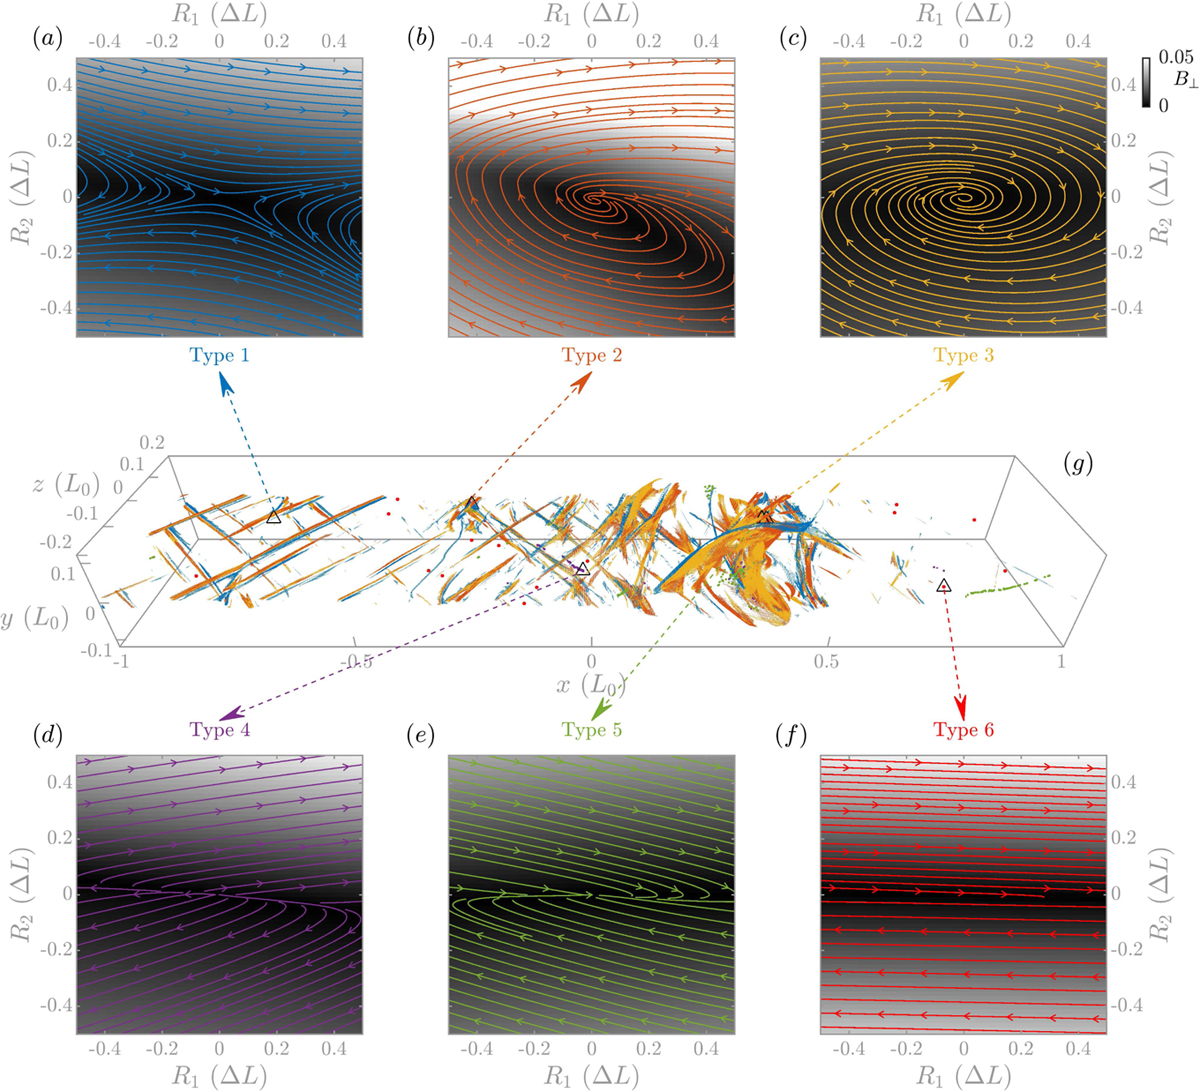
Six typical local field-line structures of B⊥ (types 1 to 6) as found in the reconnection region at t = 9. Panels (a)–(f) depict the field lines of B⊥ on the MPP of selected grid positions as labeled by black triangle markers in panel (g). Different colors correspond to different types. The distributions of B⊥ = |B⊥| are also plotted with a gray color map. In panel (g), to give a clear picture, we only plot the grids with θeig larger than a threshold value. For types 1–3, the threshold is set as 30°; for types 4–5, the threshold is 5°.
Current usage metrics show cumulative count of Article Views (full-text article views including HTML views, PDF and ePub downloads, according to the available data) and Abstracts Views on Vision4Press platform.
Data correspond to usage on the plateform after 2015. The current usage metrics is available 48-96 hours after online publication and is updated daily on week days.
Initial download of the metrics may take a while.